Answered step by step
Verified Expert Solution
Question
1 Approved Answer
Answer all parts of the question. This question relates to surface water processes. (a) An un-named stream drains to Bunatrahir Bay on the north


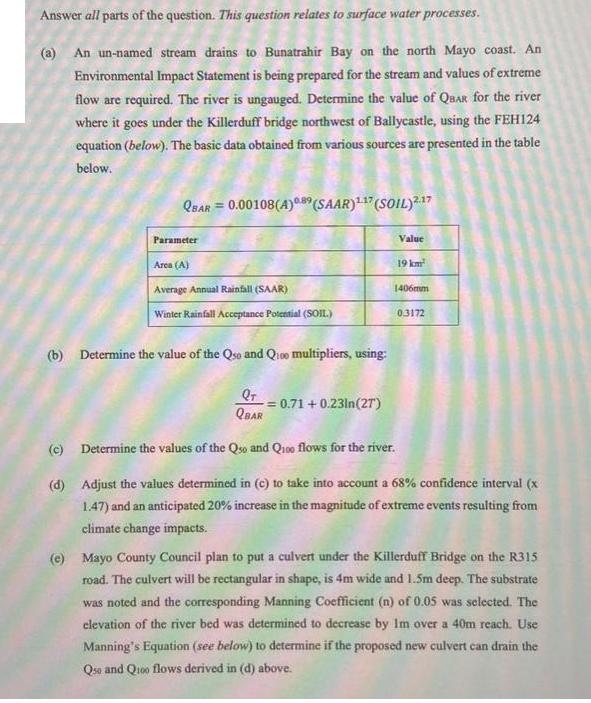
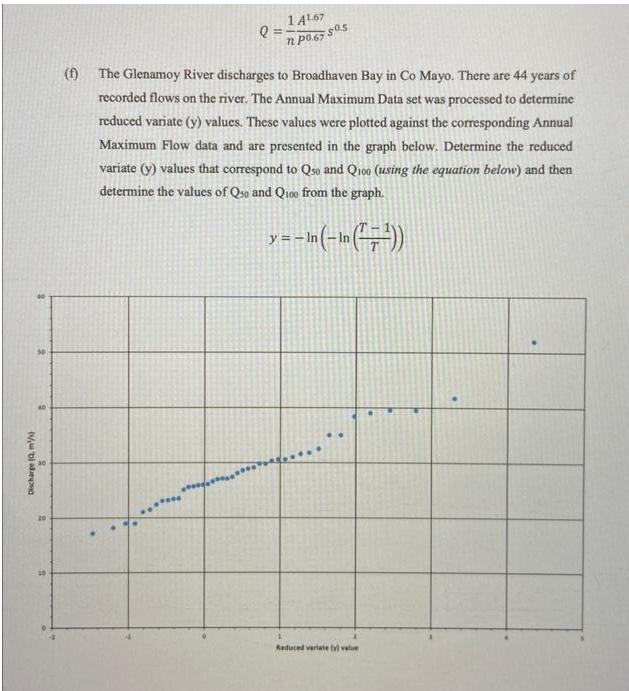
Answer all parts of the question. This question relates to surface water processes. (a) An un-named stream drains to Bunatrahir Bay on the north Mayo coast. An Environmental Impact Statement is being prepared for the stream and values of extreme flow are required. The river is ungauged. Determine the value of QBAR for the river where it goes under the Killerduff bridge northwest of Ballycastle, using the FEH124 equation (below). The basic data obtained from various sources are presented in the table below. (b) (c) (d) QBAR = 0.00108(4)089 (SAAR)17 (SOIL)2.17 Parameter Area (A) Average Annual Rainfall (SAAR) Winter Rainfall Acceptance Potential (SOIL.) Determine the value of the Qso and Quoo multipliers, using: Value = 0.71 +0.23ln(27) 19 km 1406mm 0.3172 QT QBAR Determine the values of the Qso and Q100 flows for the river. Adjust the values determined in (c) to take into account a 68% confidence interval (x 1.47) and an anticipated 20% increase in the magnitude of extreme events resulting from climate change impacts. (e) Mayo County Council plan to put a culvert under the Killerduff Bridge on the R315 road. The culvert will be rectangular in shape, is 4m wide and 1.5m deep. The substrate was noted and the corresponding Manning Coefficient (n) of 0.05 was selected. The elevation of the river bed was determined to decrease by Im over a 40m reach. Use Manning's Equation (see below) to determine if the proposed new culvert can drain the Que and Q100 flows derived in (d) above. Discharge (Q. m/) 1 A1.67 Q= n p0.67 sas: (f) The Glenamoy River discharges to Broadhaven Bay in Co Mayo. There are 44 years of recorded flows on the river. The Annual Maximum Data set was processed to determine reduced variate (y) values. These values were plotted against the corresponding Annual Maximum Flow data and are presented in the graph below. Determine the reduced variate (y) values that correspond to Qso and Q100 (using the equation below) and then determine the values of Qso and Q100 from the graph. y = - In (-In (7)) Reduced variate ty value
Step by Step Solution
★★★★★
3.40 Rating (147 Votes )
There are 3 Steps involved in it
Step: 1
a To determine the value of QBAR for the river where it goes under the Killerduff bridge northwest of Ballycastle using the FEH124 equation we must first calculate the SAAR and SOIL parameters Using t...
Get Instant Access to Expert-Tailored Solutions
See step-by-step solutions with expert insights and AI powered tools for academic success
Step: 2

Step: 3

Ace Your Homework with AI
Get the answers you need in no time with our AI-driven, step-by-step assistance
Get Started


