Answered step by step
Verified Expert Solution
Link Copied!

Question

1 Approved Answer

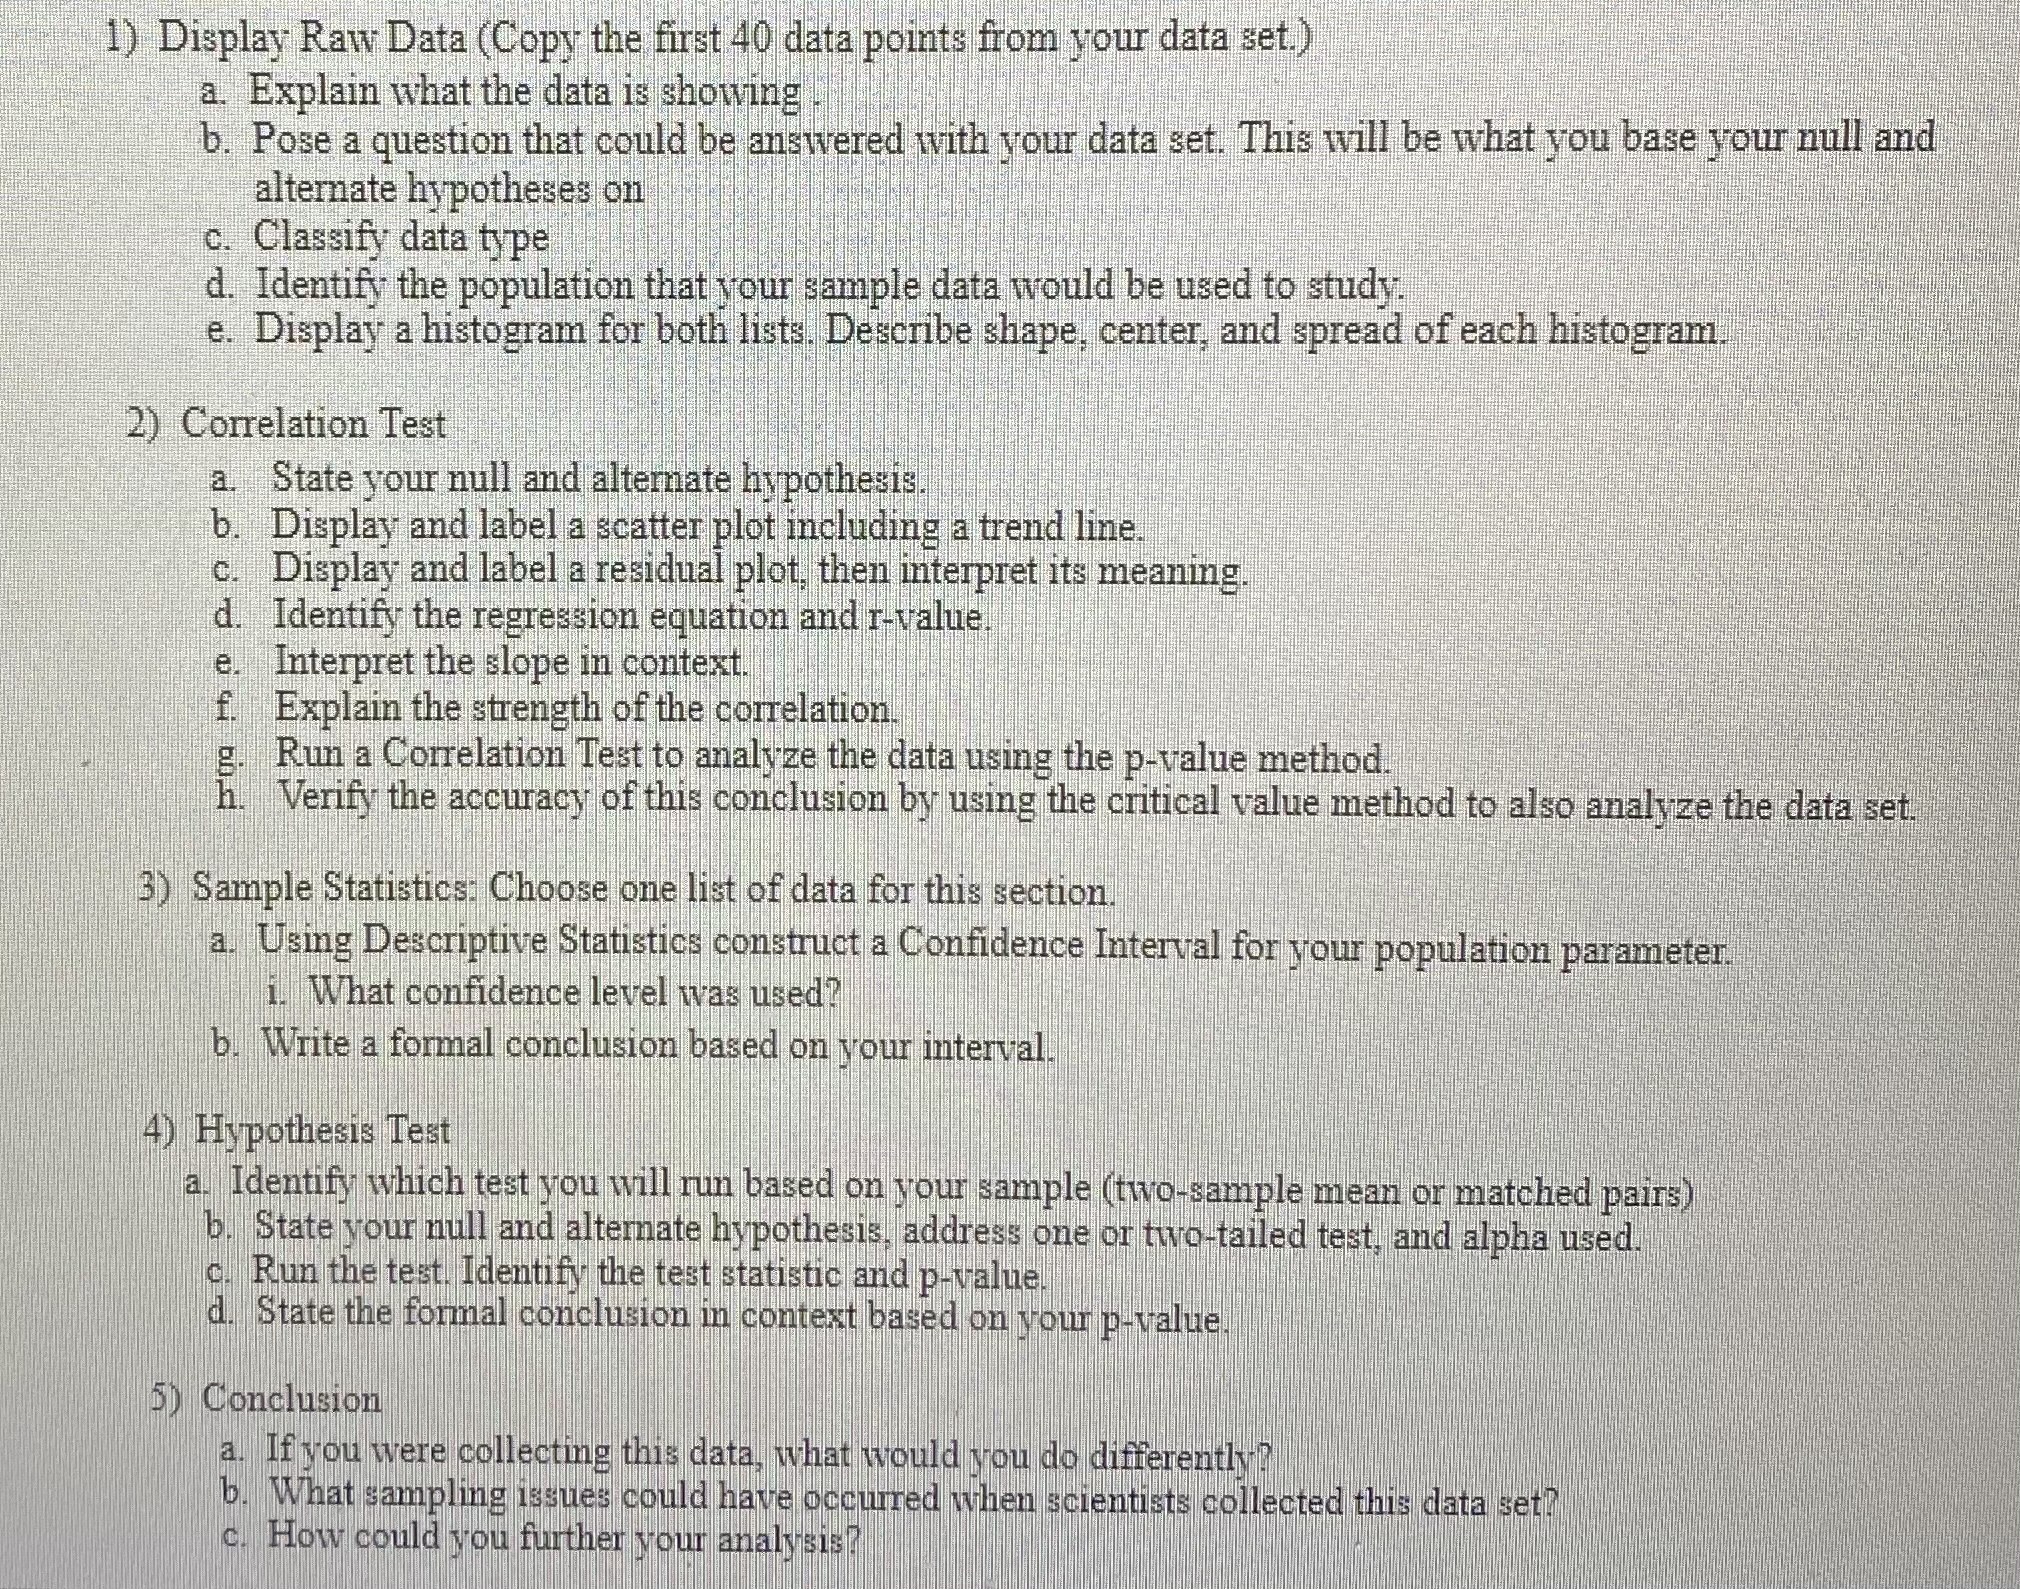
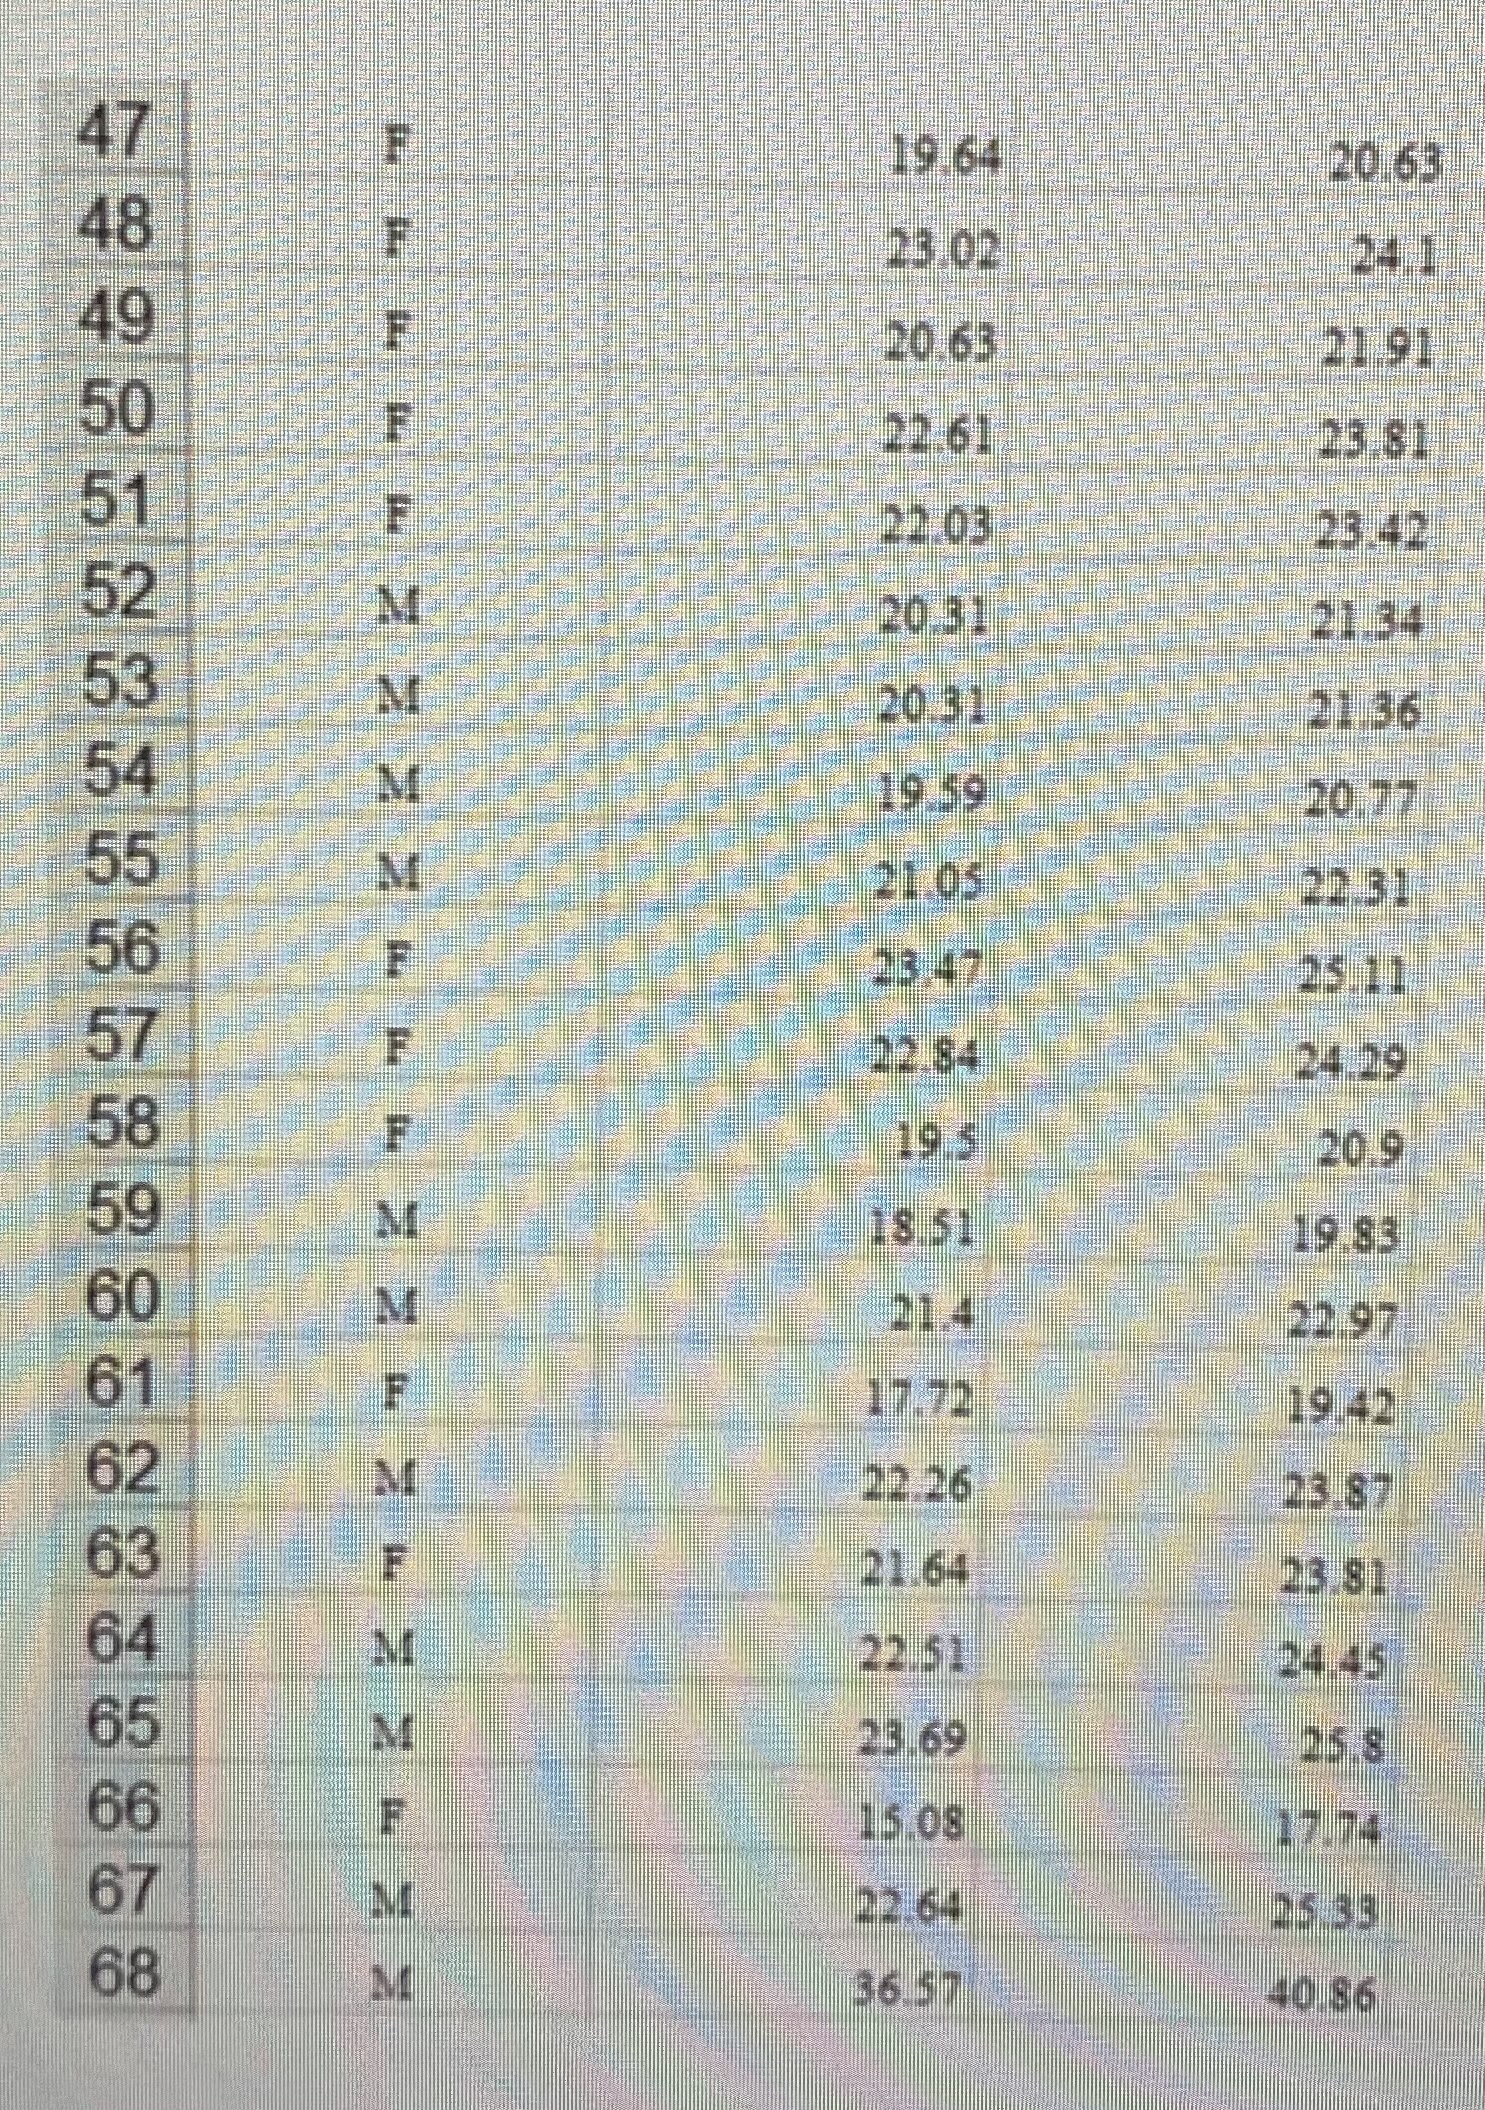
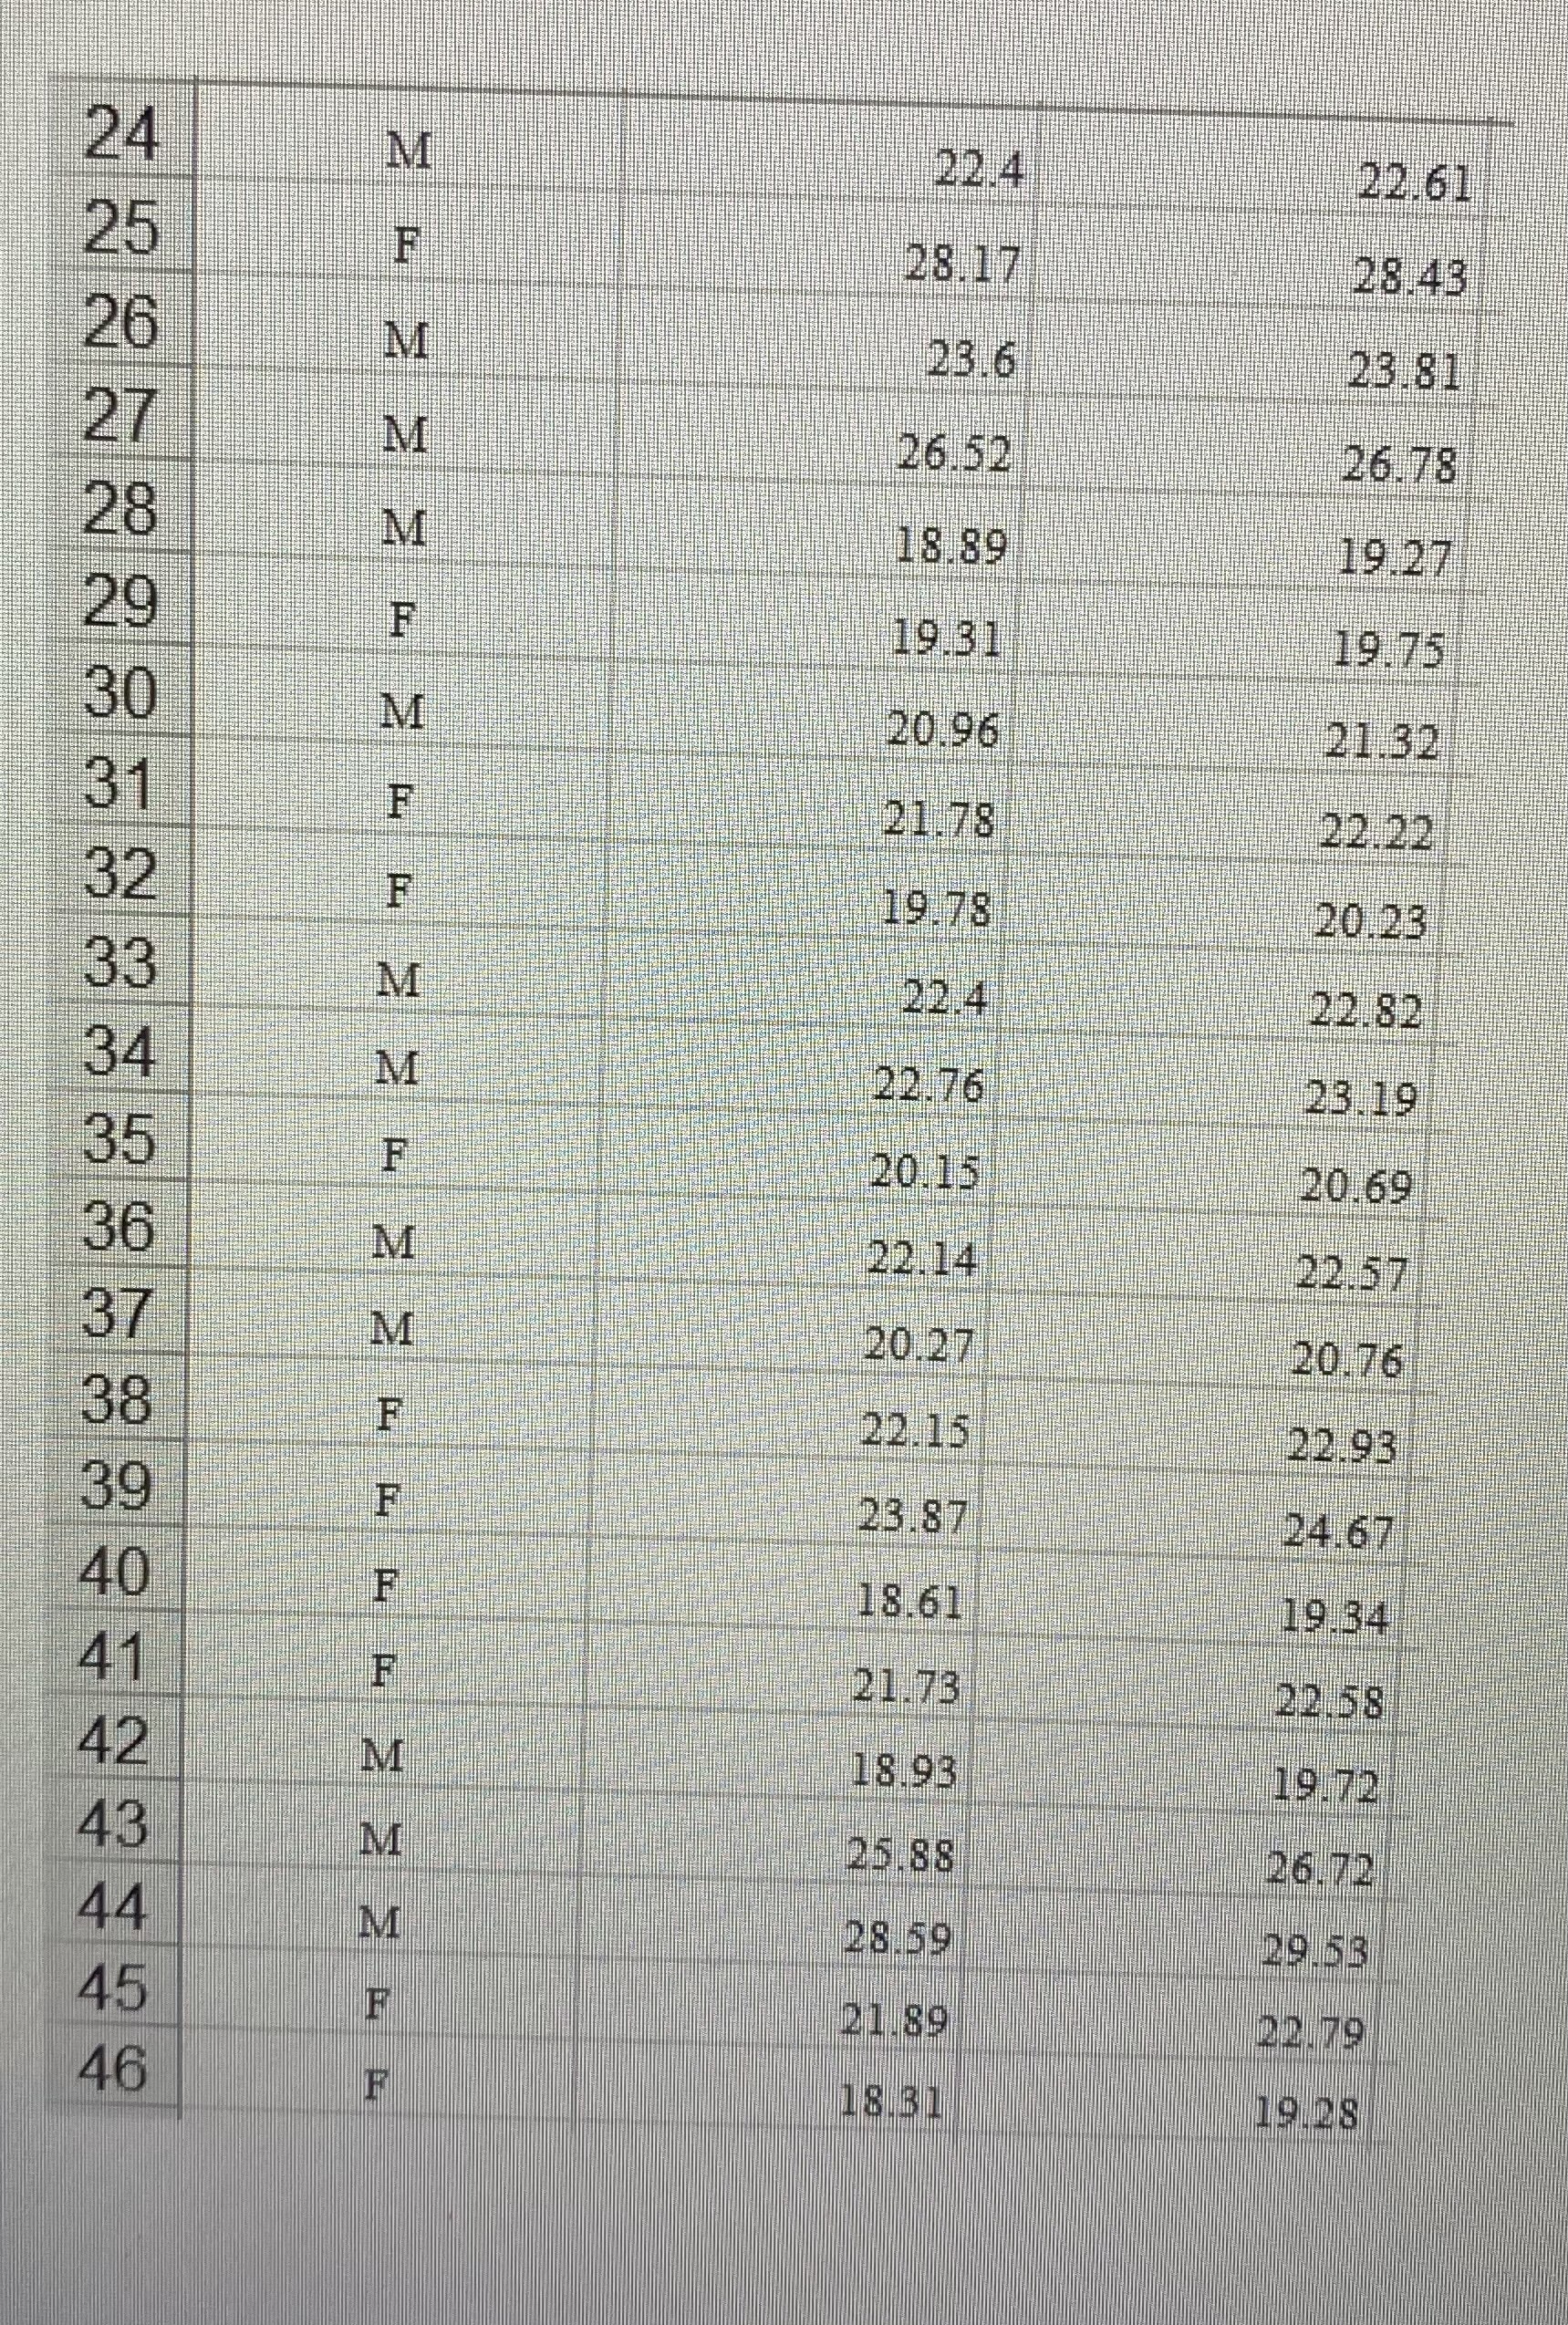
answer all the parts of this assignment pls. This needs to be done on a word document f1) Display Raw Data (Copy the first 40

answer all the parts of this assignment pls. This needs to be done on a word document
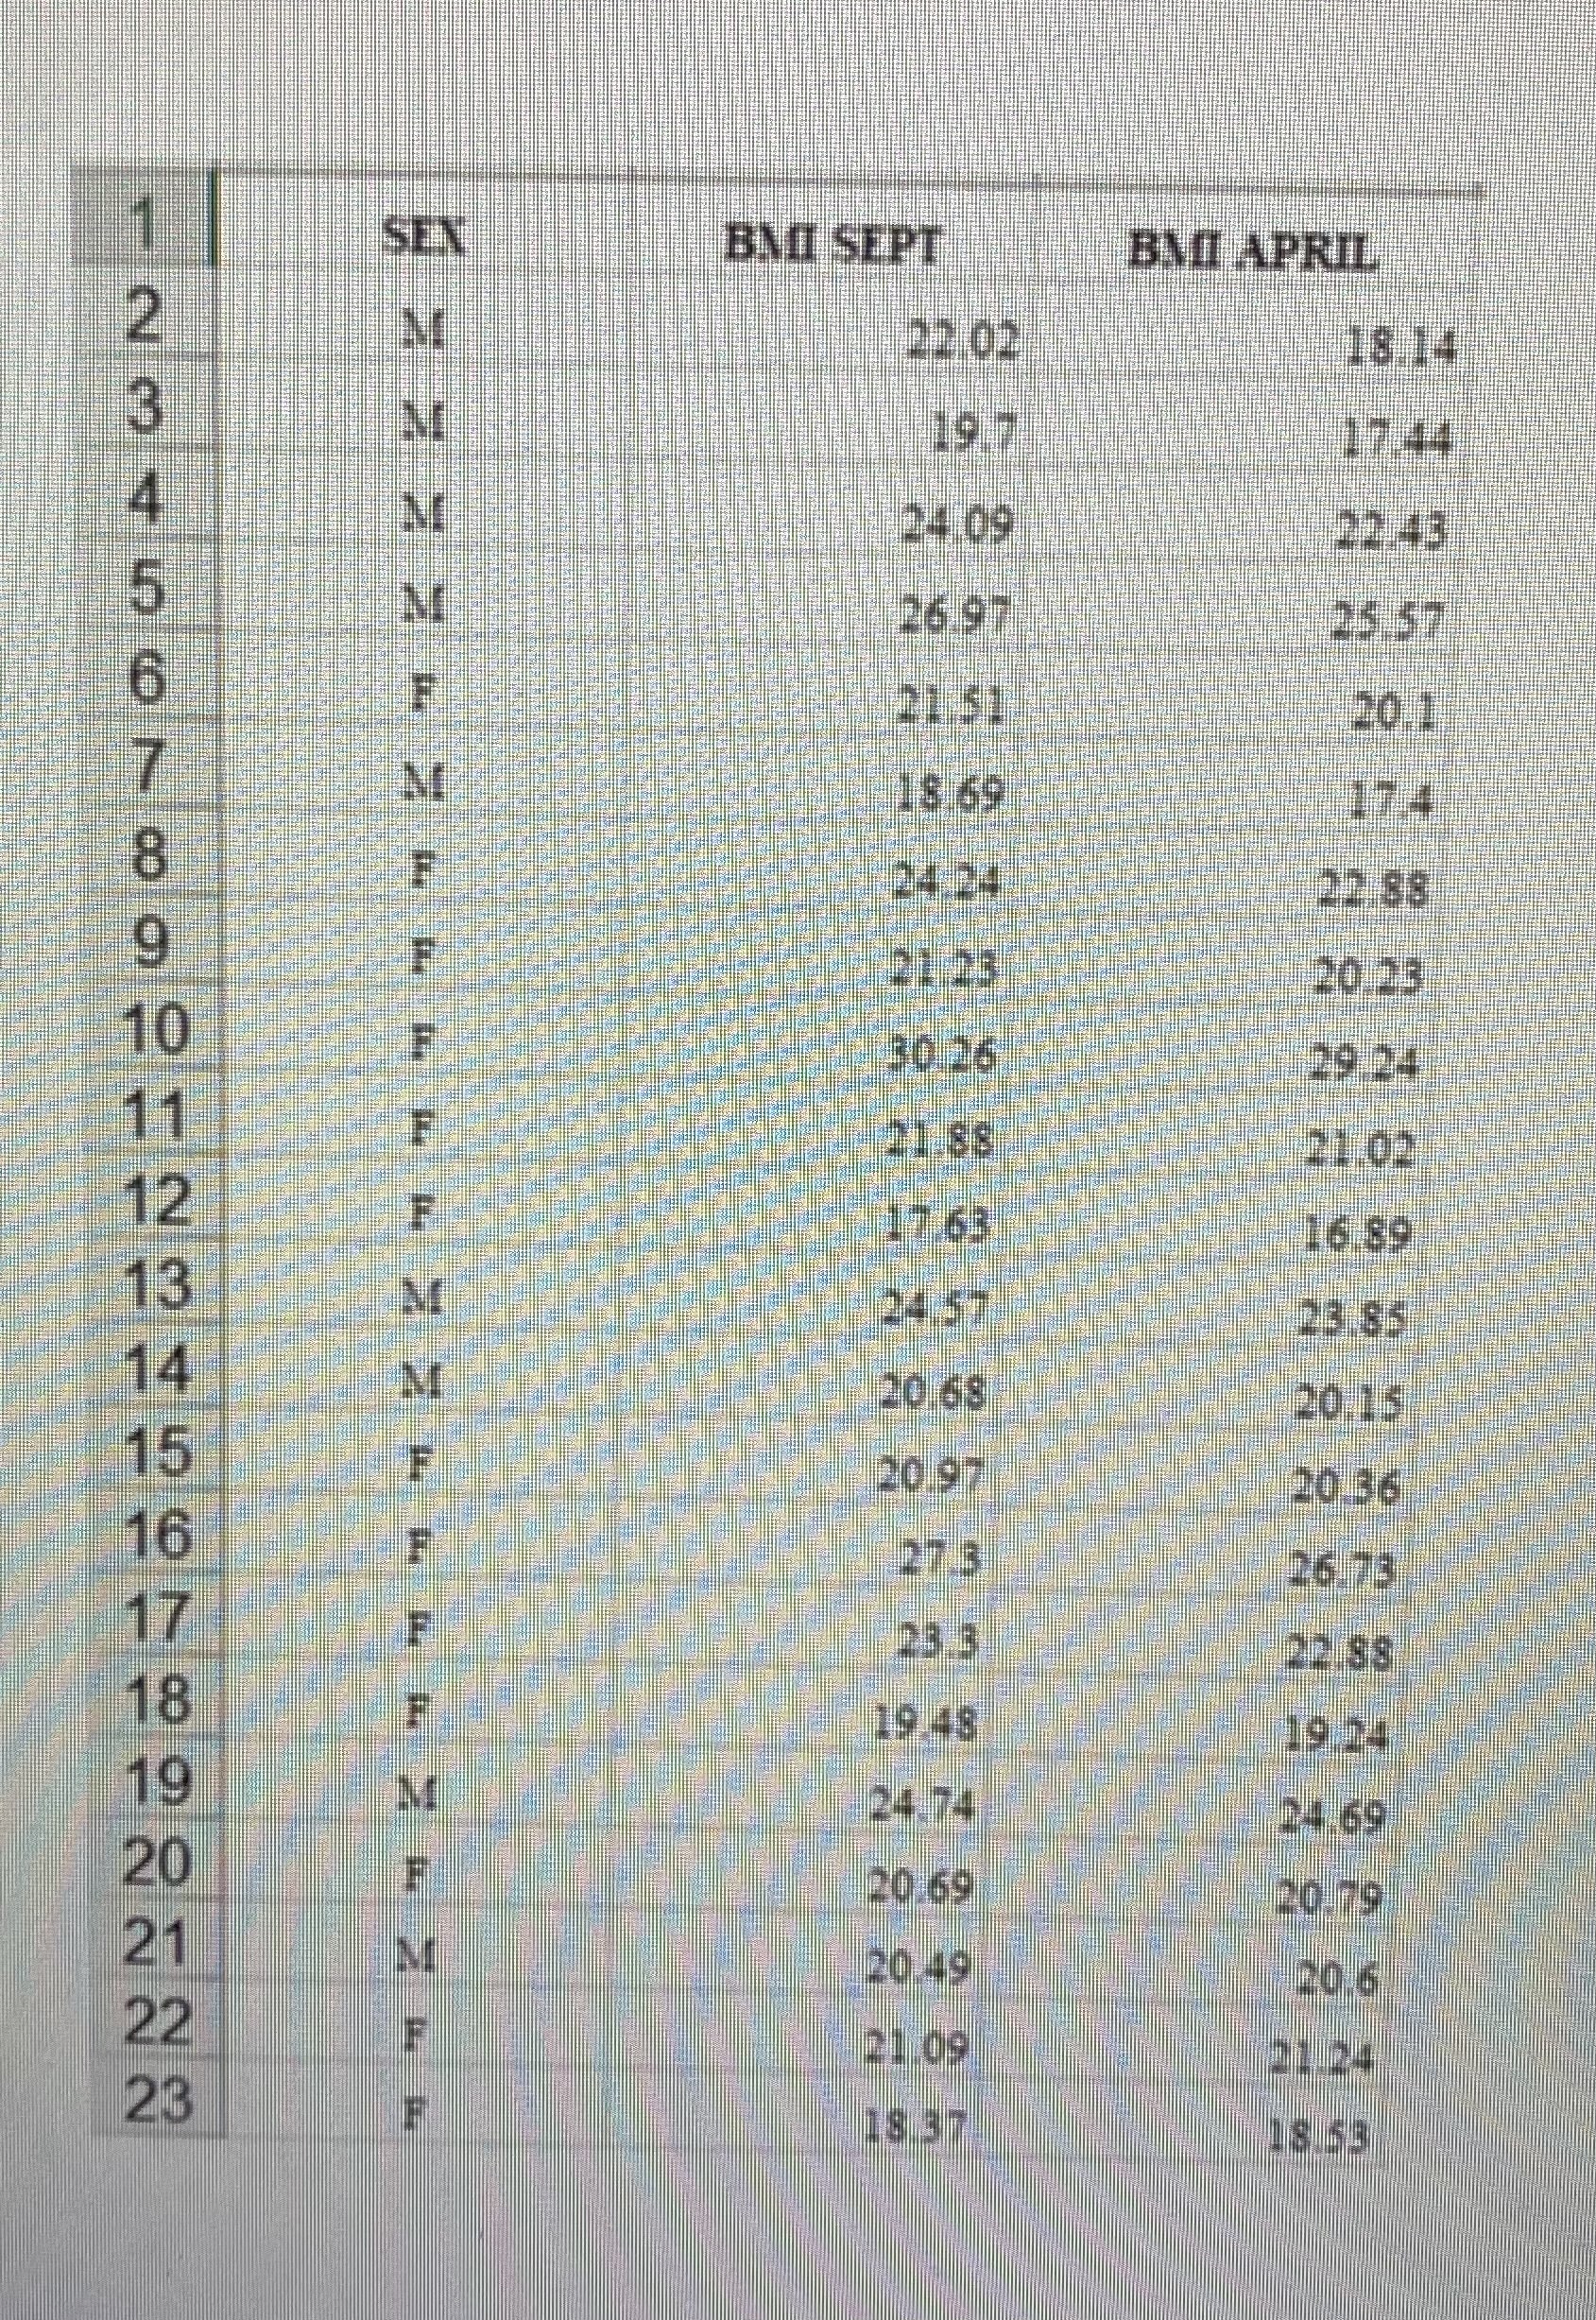
image text in transcribedimage text in transcribedimage text in transcribedimage text in transcribed
\f1) Display Raw Data (Copy the first 40 data points from your data set.) a. Explain what the data is showing . b. Pose a question that could be answered with your data set. This will be what you base your null and alternate hypotheses on c. Classify data type d. Identify the population that your sample data would be used to study. e. Display a histogram for both lists. Describe shape, center, and spread of each histogram 2) Correlation Test a. State your null and alternate hypothesis. b. Display and label a scatter plot including a trend line. . Display and label a residual plot, then interpret its meaning 1. Identify the regression equation and r-value e . Interpret the slope in context. Explain the strength of the correlation Run a Correlation Test to analyze the data using the p-value method. Verify the accuracy of this conclusion by using the critical value method to also analyze the data set. 3) Sample Statistics: Choose one list of data for this section. a. Using Descriptive Statistics construct a Confidence Interval for your population parameter. i. What confidence level was used? b. Write a formal conclusion based on your interval. 4) Hypothesis Test a. Identify which test you will run based on your sample (two-sample mean or matched pairs) b. State your null and alternate hypothesis, address one or two-tailed test, and alpha used. c. Run the test. Identify the test statistic and p-value d. State the formal conclusion in context based on your p-value 5) Conclusion a. If you were collecting this data, what would you do differently? b. What sampling issues could have occurred when scientists collected this data set? c. How could you further your analysis?\f\f

Step by Step Solution

There are 3 Steps involved in it

Step: 1

blur-text-image

Get Instant Access to Expert-Tailored Solutions

See step-by-step solutions with expert insights and AI powered tools for academic success

Step: 2

blur-text-image

Step: 3

blur-text-image

Ace Your Homework with AI

Get the answers you need in no time with our AI-driven, step-by-step assistance

Get Started

Recommended Textbook for

Probability and Random Processes With Applications to Signal Processing and Communications

Authors: Scott Miller, Donald Childers

2nd edition

123869811, 978-0121726515, 121726517, 978-0130200716, 978-0123869814

More Books

Students also viewed these Mathematics questions

Question

What are the main steps for developing a ToC?

Answered: 1 week ago