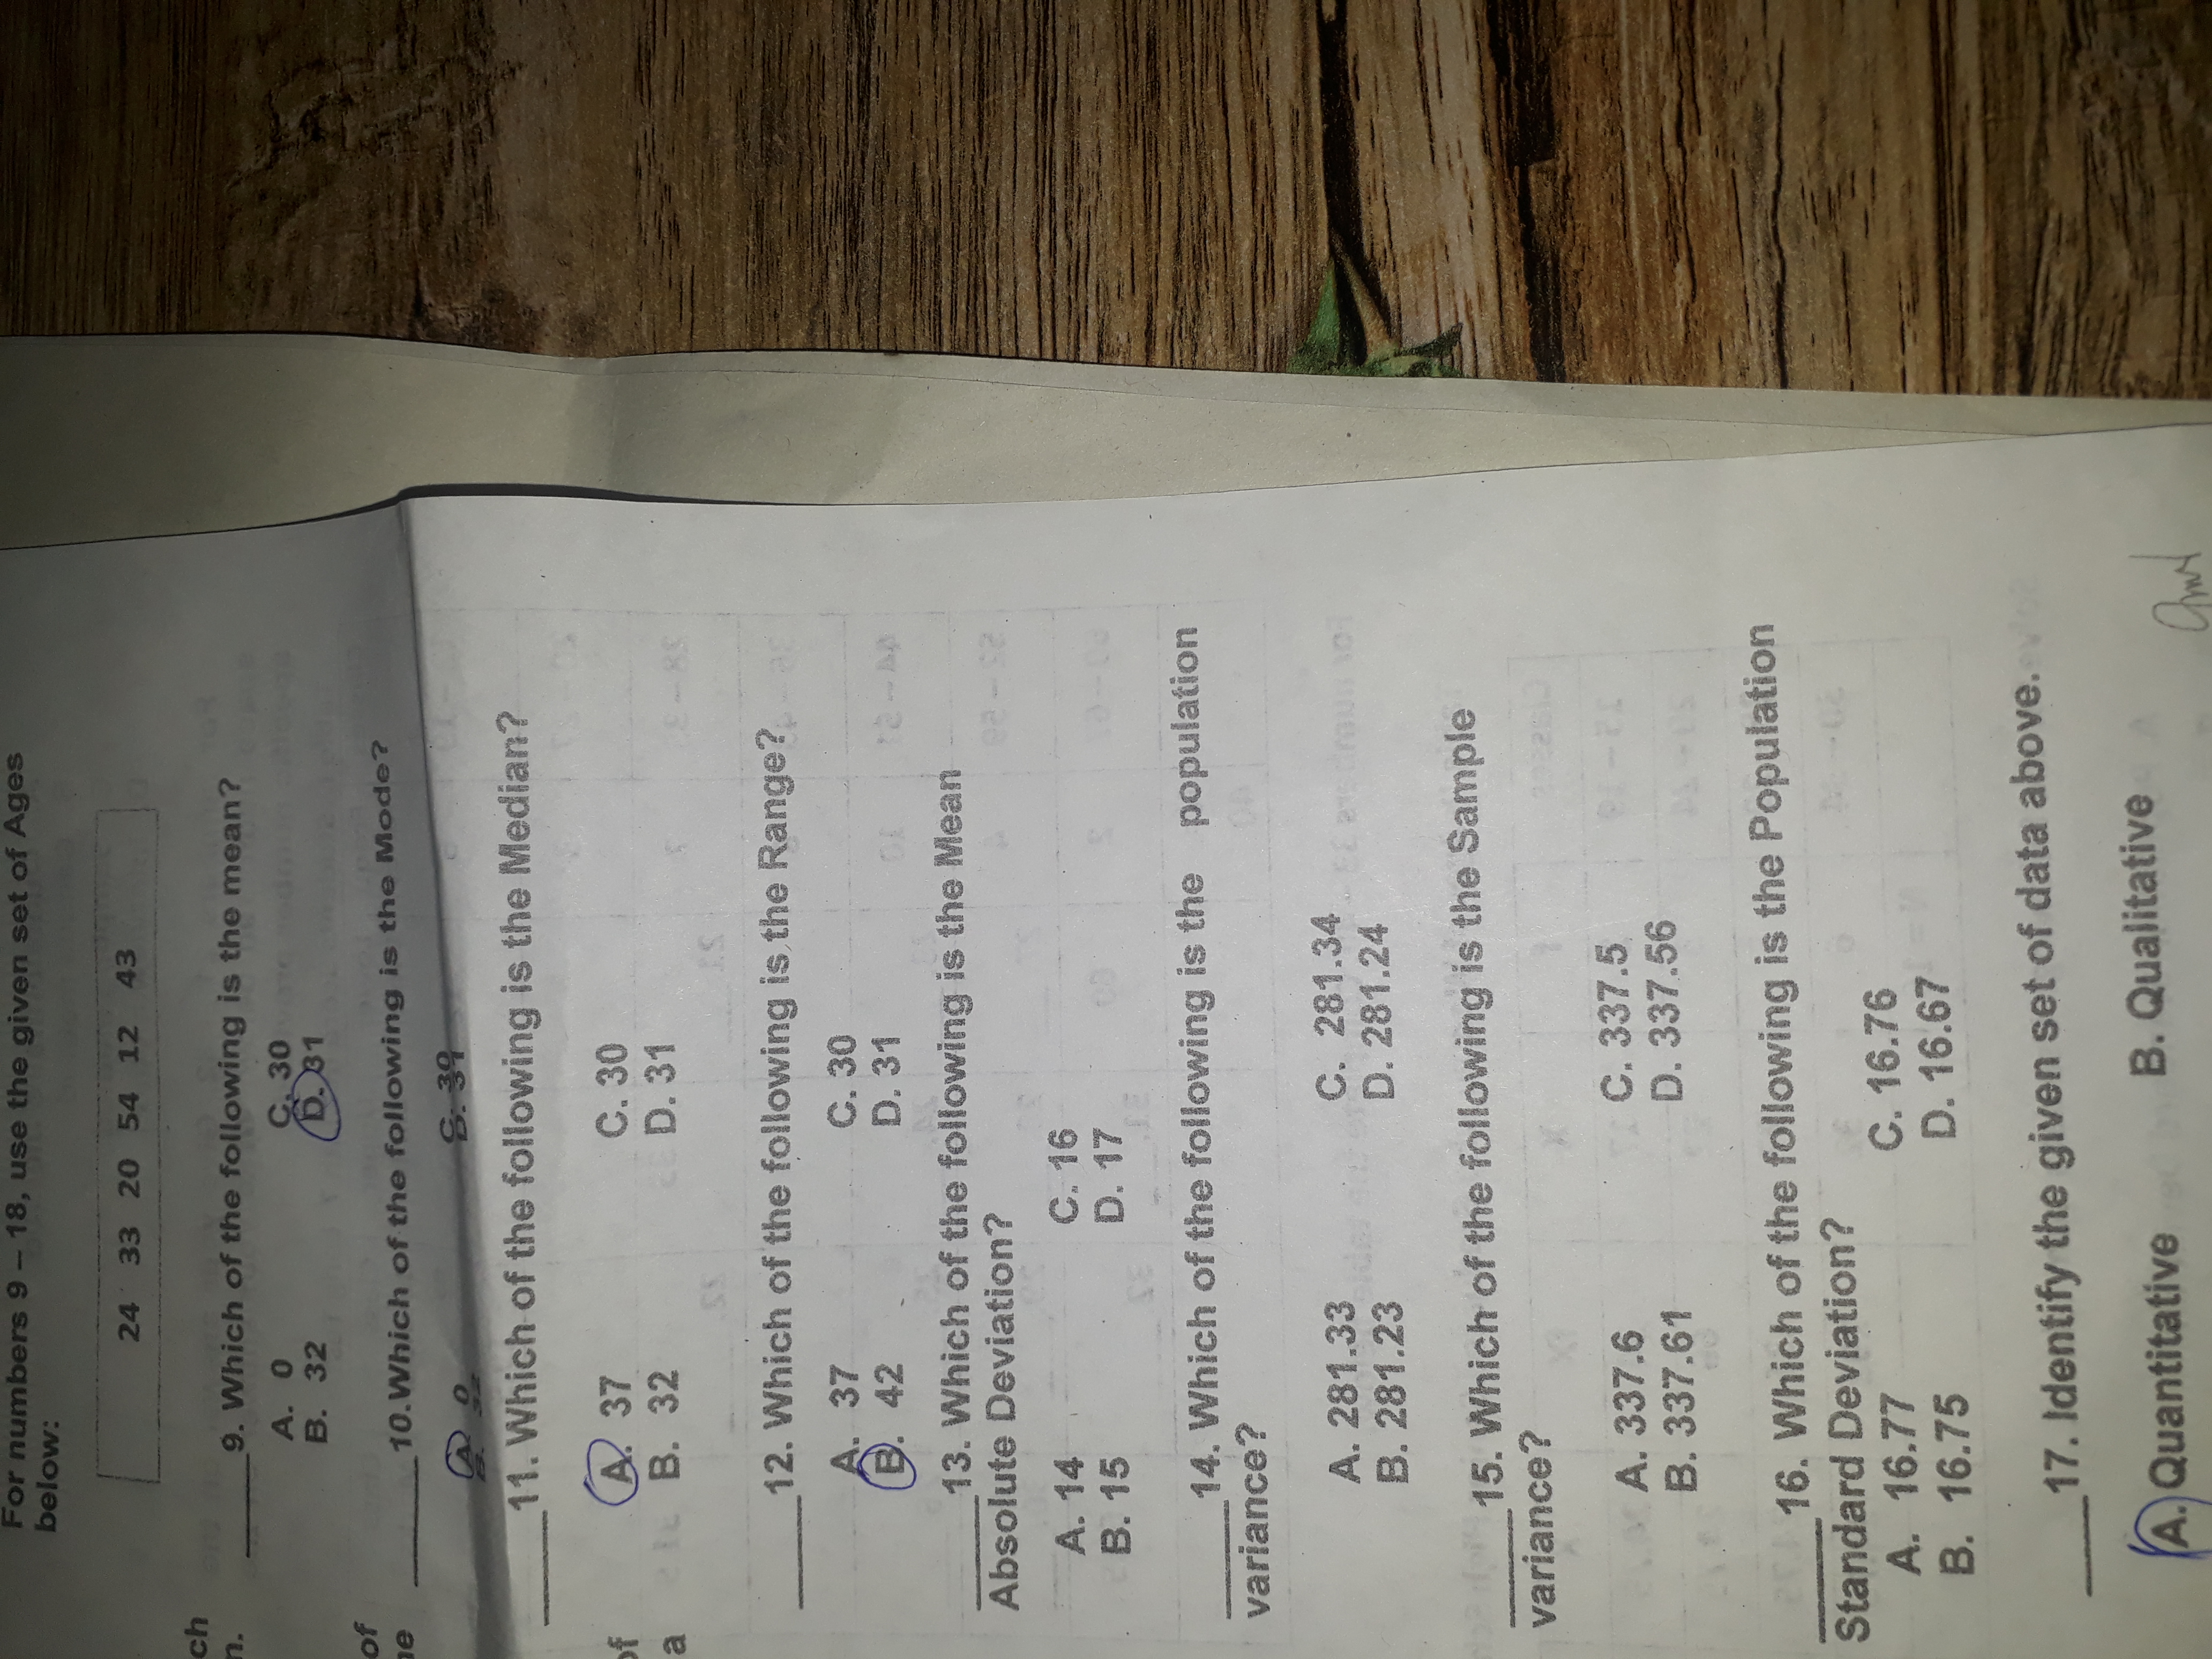
answer directly plsss no need for long explanation
For numbers 9 - 18, use the given set of Ages below: 24 33 20 54 12 43 ch 9. Which of the following is the mean? A. 0 C. 30 B. 32 D. 31 of e 10. Which of the following is the Mode? 8. 39 11. Which of the following is the Median? A. 37 C. 30 B. 32 D. 31 12. Which of the following is the Range? 37 C. 30 42 D. 31 13. Which of the following is the Mean Absolute Deviation? ea -ca A. 14 C. 16 B. 15 D. 17 14. Which of the following is the population variance? A. 281.33 C. 281.34 B. 281.23 D. 281.24 15. Which of the following is the Sample variance? A. 337.6 C. 337.5 B. 337.61 D. 337.56 16. Which of the following is the Population Standard Deviation? A. 16.77 C. 16.76 B. 16.75 D. 16.67 17. Identify the given set of data above. A. Quantitative B. Qualitative18. Is the given set of data above a Discrete Variable? A. YES B. NO Write your answer for Table 1. here: 19. If you want to know the number of 21. people living in Barangay Mangagoy, which of the 22. following is the best method of collecting the data? 23. A. Questionnaire method B. Census method 24. C. Sampling method D. Interview method 25. 20. If you want to know how many students 26. are enrolled in Grade 7 in STIP, which of the following method you will use? 27. A. Questionnaire method B. Census method 28. C. Sampling method D. Interview method 29. For numbers 21 - 32. Give your answer on the 30. space numbered below. Write your answer on the 31. specific number provided. Table I. Students Score in Math 7 Long Test 32. Classes Frequ | Lower Upper Class Class ency Limit Limit Boundari Marks es 12 - 19 12 19 11.5 - 15.5 19.5 20-27 3 35 31.5 28 - 35 7 21. 22. 36 -43 44 - 51 10 23. 24. 25 26. 52 -59 4 27 28. 29 30. 60 - 67 2 60 63.5 31. 32. N= 40 For numbers 33 - 40. Complete the table below. Table II. Ages of Women who Graduated Senior High School Classes X FX X I X- XI X - X 12 flX - x12 15 - 19 2 17 34 24.75 20- 24 3 22 66 24.75 25- 29 5 27 135 24.75 30-34 6 32 192 24.75 N = 16 Solve for the following: Use data from table II. A. Population Standard Deviation B. Sample Standard Deviation S =MATHEMATICS 7 Table 1. Scores of 50 Students in Mathematics 7 Summative Test Class Class Interval Frequency Mark f FXm (Xm) cf Mean X-X 1x-X/ 1x - x / 2 28 - 32 5 30 150 5 23- 27 8 25 200 13 18- 22 15 26 80 0 28 13- 17 12 15 180 40 8- 12 7 10 70 47 3-7 3 5 15 50 N = 50 [rxm = 915 Solution