Question
Answer each of the following questions. When necessary or as directed, provide as much detail as needed to justify the final answer. 2. 0.0

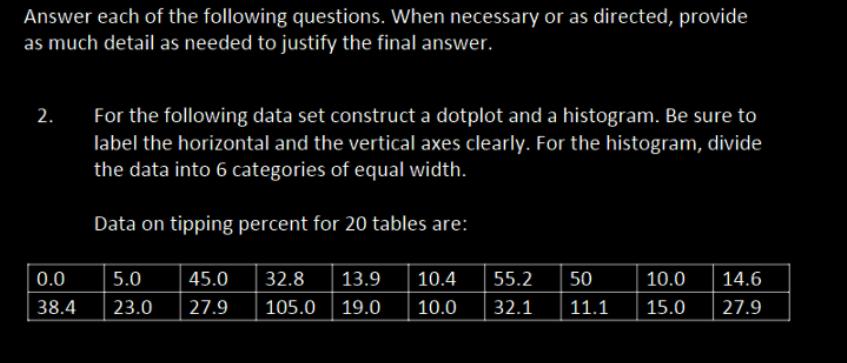
Answer each of the following questions. When necessary or as directed, provide as much detail as needed to justify the final answer. 2. 0.0 38.4 For the following data set construct a dotplot and a histogram. Be sure to label the horizontal and the vertical axes clearly. For the histogram, divide the data into 6 categories of equal width. Data on tipping percent for 20 tables are: 5.0 23.0 45.0 32.8 13.9 10.4 55.2 50 27.9 105.0 19.0 10.0 32.1 11.1 10.0 15.0 14.6 27.9
Step by Step Solution
3.48 Rating (155 Votes )
There are 3 Steps involved in it
Step: 1
General Guidance The answer provided below has been developed in a clear step by ...
Get Instant Access to Expert-Tailored Solutions
See step-by-step solutions with expert insights and AI powered tools for academic success
Step: 2

Step: 3

Ace Your Homework with AI
Get the answers you need in no time with our AI-driven, step-by-step assistance
Get StartedRecommended Textbook for
Auditing Cases An Interactive Learning Approach
Authors: Mark S Beasley, Frank A. Buckless, Steven M. Glover, Douglas F Prawitt
7th Edition
0134421825, 9780134421827
Students also viewed these Accounting questions
Question
Answered: 1 week ago
Question
Answered: 1 week ago
Question
Answered: 1 week ago
Question
Answered: 1 week ago
Question
Answered: 1 week ago
Question
Answered: 1 week ago
Question
Answered: 1 week ago
Question
Answered: 1 week ago
Question
Answered: 1 week ago
Question
Answered: 1 week ago
Question
Answered: 1 week ago
Question
Answered: 1 week ago
Question
Answered: 1 week ago
Question
Answered: 1 week ago
Question
Answered: 1 week ago
Question
Answered: 1 week ago
Question
Answered: 1 week ago
Question
Answered: 1 week ago
Question
Answered: 1 week ago
Question
Answered: 1 week ago
Question
Answered: 1 week ago
View Answer in SolutionInn App


