

Answered step by step
Verified Expert Solution
Question
1 Approved Answer
answer ignoring minimal variance part The following data apply to Problems 8-12. A pension fund manager is considering three mutual funds. The first is a
answer ignoring minimal variance part
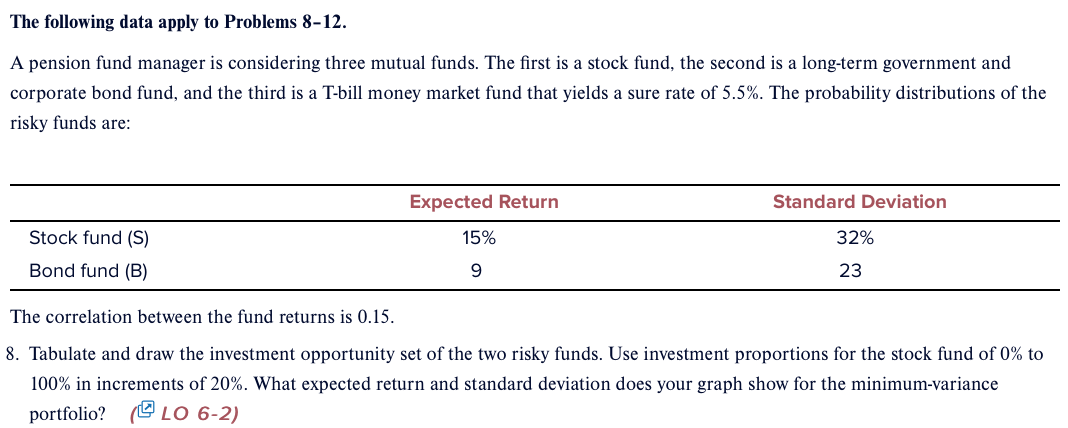
The following data apply to Problems 8-12. A pension fund manager is considering three mutual funds. The first is a stock fund, the second is a long-term government and corporate bond fund, and the third is a T-bill money market fund that yields a sure rate of 5.5%. The probability distributions of the risky funds are: The correlation between the fund returns is 0.15 . 8. Tabulate and draw the investment opportunity set of the two risky funds. Use investment proportions for the stock fund of 0% to 100% in increments of 20%. What expected return and standard deviation does your graph show for the minimum-variance portfolio? ( LO2 )Step by Step Solution
There are 3 Steps involved in it
Step: 1

Get Instant Access to Expert-Tailored Solutions
See step-by-step solutions with expert insights and AI powered tools for academic success
Step: 2

Step: 3
Ace Your Homework with AI
Get the answers you need in no time with our AI-driven, step-by-step assistance
Get Started
Investment Analysis And Portfolio Management
Authors: Frank K. Reilly, Keith C. Brown
7th Edition
0324171730, 978-0324171730