Answer needed is in yellow. Please give the formula used to find answer with the given cell numbers (ex: c15-b45) to help me understand. Thank you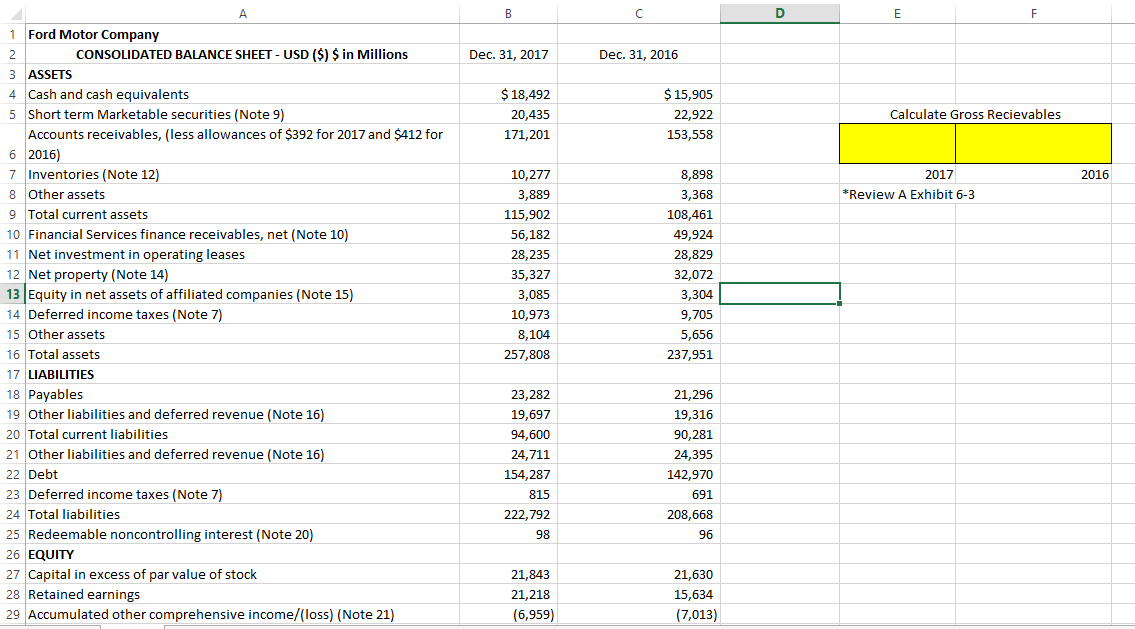
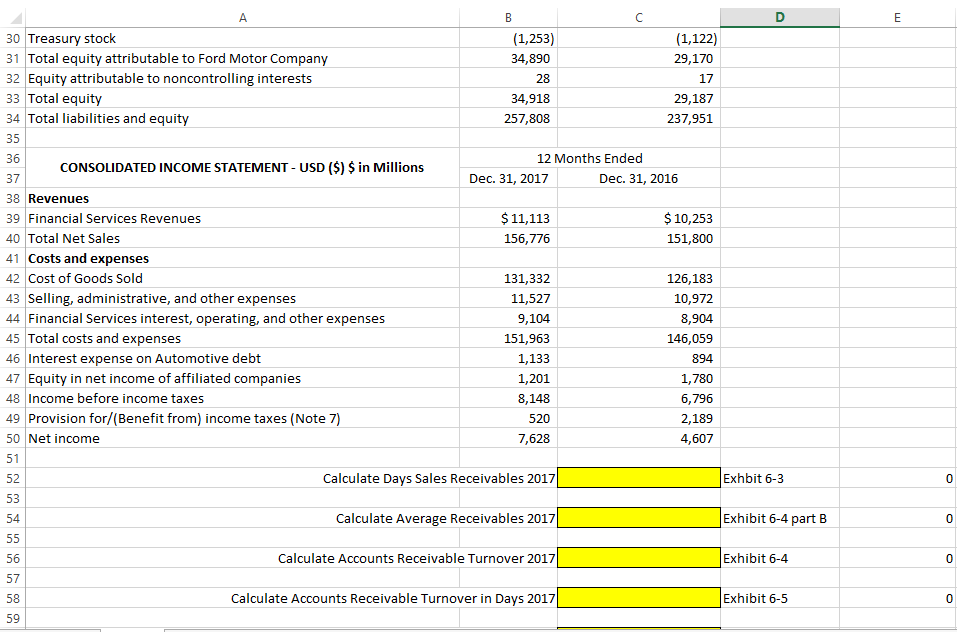
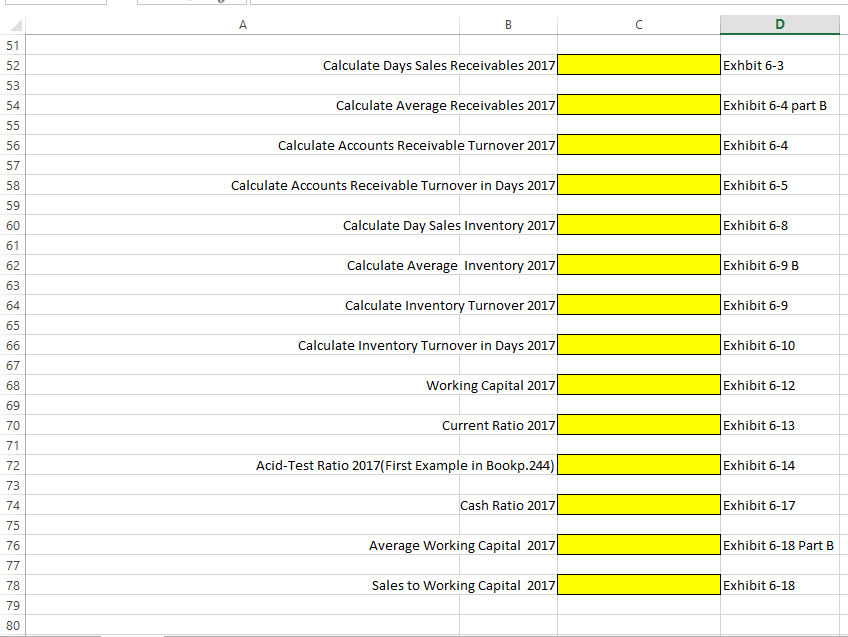
B C E F Dec. 31, 2017 Dec. 31, 2016 $ 18,492 20,435 171,201 $ 15,905 22,922 153,558 Calculate Gross Recievables 2016 2017 *Review A Exhibit 6-3 A 1 Ford Motor Company 2 CONSOLIDATED BALANCE SHEET - USD ($) $ in Millions 3 ASSETS 4 Cash and cash equivalents 5 Short term Marketable securities (Note 9) Accounts receivables, (less allowances of $392 for 2017 and $412 for 6 2016) 7 Inventories (Note 12) 8 Other assets 9 Total current assets 10 Financial Services finance receivables, net (Note 10) 11 Net investment in operating leases 12 Net property (Note 14) 13 Equity in net assets of affiliated companies (Note 15) 14 Deferred income taxes (Note 7) 15 Other assets 16 Total assets 17 LIABILITIES 18 Payables 19 Other liabilities and deferred revenue (Note 16) 20 Total current liabilities 21 Other liabilities and deferred revenue (Note 16) 22 Debt 23 Deferred income taxes (Note 7) 24 Total liabilities 25 Redeemable noncontrolling interest (Note 20) 26 EQUITY 27 Capital in excess of par value of stock 28 Retained earnings 29 Accumulated other comprehensive income/(loss) (Note 21) 10,277 3,889 115,902 56,182 28,235 35,327 3,085 10,973 8,104 257,808 8,898 3,368 108,461 49,924 28,829 32,072 3,304 9,705 5,656 237,951 23,282 19,697 94,600 24,711 154,287 815 222,792 98 21,296 19,316 90,281 24,395 142,970 691 208,668 96 21,843 21,218 (6,959) 21,630 15,634 (7,013) D E A 30 Treasury stock 31 Total equity attributable to Ford Motor Company 32 Equity attributable to noncontrolling interests 33 Total equity 34 Total liabilities and equity 35 B (1,253) 34,890 28 34,918 257,808 (1,122) 29,170 17 29,187 237,951 36 12 Months Ended Dec. 31, 2017 Dec. 31, 2016 $ 11,113 156,776 $ 10,253 151,800 CONSOLIDATED INCOME STATEMENT - USD ($) $ in Millions 37 38 Revenues 39 Financial Services Revenues 40 Total Net Sales 41 Costs and expenses 42 Cost of Goods Sold 43 Selling, administrative, and other expenses 44 Financial Services interest, operating, and other expenses 45 Total costs and expenses 46 Interest expense on Automotive debt 47 Equity in net income of affiliated companies 48 Income before income taxes 49 Provision for/(Benefit from) income taxes (Note 7) 131,332 11,527 9,104 151,963 1,133 1,201 8,148 520 7,628 126,183 10,972 8,904 146,059 894 1,780 6,796 2,189 4,607 50 Net income 51 52 Calculate Days Sales Receivables 2017 Exhbit 6-3 0 53 54 Calculate Average Receivables 2017| Exhibit 6-4 part B 0 55 56 Calculate Accounts Receivable Turnover 2017 Exhibit 6-4 0 57 58 Calculate Accounts Receivable Turnover in Days 2017 Exhibit 6-5 0 59 A C 51 52 Calculate Days Sales Receivables 2017 Exhbit 6-3 53 54 Calculate Average Receivables 2017 Exhibit 6-4 part B 55 56 Calculate Accounts Receivable Turnover 2017 Exhibit 6-4 57 58 Calculate Accounts Receivable Turnover in Days 2017| Exhibit 6-5 59 60 Calculate Day Sales Inventory 2017 Exhibit 6-8 61 62 Calculate Average Inventory 2017| Exhibit 6-9 B 63 64 Calculate Inventory Turnover 2017 Exhibit 6-9 65 66 Calculate Inventory Turnover in Days 2017| Exhibit 6-10 67 68 Working Capital 2017 Exhibit 6-12 69 70 Current Ratio 2017 Exhibit 6-13 71 Acid-Test Ratio 2017(First Example in Bookp.244) Exhibit 6-14 72 73 74 Cash Ratio 2017 Exhibit 6-17 75 76 Average Working Capital 2017 Exhibit 6-18 Part B 77 78 Sales to Working Capital 2017 Exhibit 6-18 79 80 B C E F Dec. 31, 2017 Dec. 31, 2016 $ 18,492 20,435 171,201 $ 15,905 22,922 153,558 Calculate Gross Recievables 2016 2017 *Review A Exhibit 6-3 A 1 Ford Motor Company 2 CONSOLIDATED BALANCE SHEET - USD ($) $ in Millions 3 ASSETS 4 Cash and cash equivalents 5 Short term Marketable securities (Note 9) Accounts receivables, (less allowances of $392 for 2017 and $412 for 6 2016) 7 Inventories (Note 12) 8 Other assets 9 Total current assets 10 Financial Services finance receivables, net (Note 10) 11 Net investment in operating leases 12 Net property (Note 14) 13 Equity in net assets of affiliated companies (Note 15) 14 Deferred income taxes (Note 7) 15 Other assets 16 Total assets 17 LIABILITIES 18 Payables 19 Other liabilities and deferred revenue (Note 16) 20 Total current liabilities 21 Other liabilities and deferred revenue (Note 16) 22 Debt 23 Deferred income taxes (Note 7) 24 Total liabilities 25 Redeemable noncontrolling interest (Note 20) 26 EQUITY 27 Capital in excess of par value of stock 28 Retained earnings 29 Accumulated other comprehensive income/(loss) (Note 21) 10,277 3,889 115,902 56,182 28,235 35,327 3,085 10,973 8,104 257,808 8,898 3,368 108,461 49,924 28,829 32,072 3,304 9,705 5,656 237,951 23,282 19,697 94,600 24,711 154,287 815 222,792 98 21,296 19,316 90,281 24,395 142,970 691 208,668 96 21,843 21,218 (6,959) 21,630 15,634 (7,013) D E A 30 Treasury stock 31 Total equity attributable to Ford Motor Company 32 Equity attributable to noncontrolling interests 33 Total equity 34 Total liabilities and equity 35 B (1,253) 34,890 28 34,918 257,808 (1,122) 29,170 17 29,187 237,951 36 12 Months Ended Dec. 31, 2017 Dec. 31, 2016 $ 11,113 156,776 $ 10,253 151,800 CONSOLIDATED INCOME STATEMENT - USD ($) $ in Millions 37 38 Revenues 39 Financial Services Revenues 40 Total Net Sales 41 Costs and expenses 42 Cost of Goods Sold 43 Selling, administrative, and other expenses 44 Financial Services interest, operating, and other expenses 45 Total costs and expenses 46 Interest expense on Automotive debt 47 Equity in net income of affiliated companies 48 Income before income taxes 49 Provision for/(Benefit from) income taxes (Note 7) 131,332 11,527 9,104 151,963 1,133 1,201 8,148 520 7,628 126,183 10,972 8,904 146,059 894 1,780 6,796 2,189 4,607 50 Net income 51 52 Calculate Days Sales Receivables 2017 Exhbit 6-3 0 53 54 Calculate Average Receivables 2017| Exhibit 6-4 part B 0 55 56 Calculate Accounts Receivable Turnover 2017 Exhibit 6-4 0 57 58 Calculate Accounts Receivable Turnover in Days 2017 Exhibit 6-5 0 59 A C 51 52 Calculate Days Sales Receivables 2017 Exhbit 6-3 53 54 Calculate Average Receivables 2017 Exhibit 6-4 part B 55 56 Calculate Accounts Receivable Turnover 2017 Exhibit 6-4 57 58 Calculate Accounts Receivable Turnover in Days 2017| Exhibit 6-5 59 60 Calculate Day Sales Inventory 2017 Exhibit 6-8 61 62 Calculate Average Inventory 2017| Exhibit 6-9 B 63 64 Calculate Inventory Turnover 2017 Exhibit 6-9 65 66 Calculate Inventory Turnover in Days 2017| Exhibit 6-10 67 68 Working Capital 2017 Exhibit 6-12 69 70 Current Ratio 2017 Exhibit 6-13 71 Acid-Test Ratio 2017(First Example in Bookp.244) Exhibit 6-14 72 73 74 Cash Ratio 2017 Exhibit 6-17 75 76 Average Working Capital 2017 Exhibit 6-18 Part B 77 78 Sales to Working Capital 2017 Exhibit 6-18 79 80