Answered step by step
Verified Expert Solution
Question
1 Approved Answer
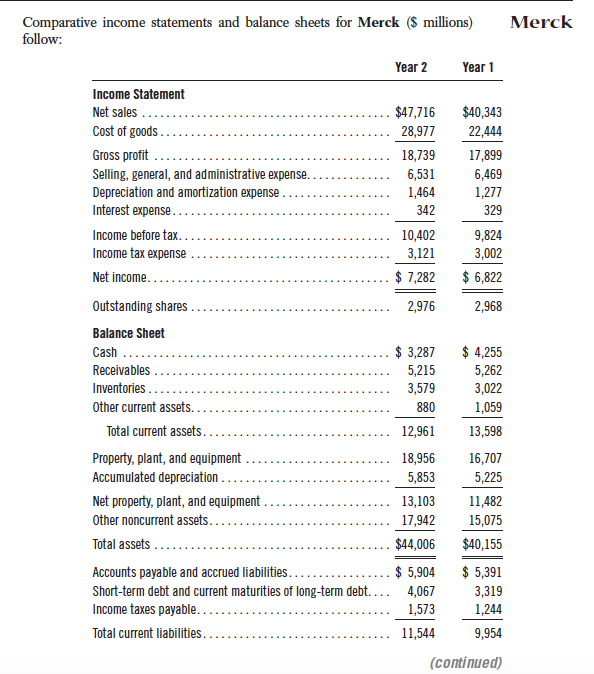
Answer Part b Comparative income statements and balance sheets for Merck millions Merck follow: Year 2 Year 1 Income Statement . $47,716 $40,343 28,977 22,444


Answer Part b
Comparative income statements and balance sheets for Merck millions Merck follow: Year 2 Year 1 Income Statement . $47,716 $40,343 28,977 22,444 . 18,739 17,899 6,469 ,464 1,277 329 9,824 3,002 Gross profit 6,531 . 342 . 10,402 3,121 Net income . $ 7,282 6,822 2,976 2,968 Balance Sheet Cash Receivables . $ 3,287 4,255 5,215 5,262 3,022 1,059 . 3,579 . 880 12,96 13,598 . 18,956 16,707 5,225 11,482 15,075 $44,006 $40,155 Total current assets.... Accumulated depreciation 5,853 . 13,103 17,942 Other noncurrent assets... Accounts payable and accrued liabilities.......... . . .. .. 5,904 4,067 1,573 . 11,544 $ 5,391 3,319 1,244 9,954 Short-term debt and current maturities of long-term debt. Total current liabilities.... (continued)Step by Step Solution
There are 3 Steps involved in it
Step: 1

Get Instant Access to Expert-Tailored Solutions
See step-by-step solutions with expert insights and AI powered tools for academic success
Step: 2

Step: 3

Ace Your Homework with AI
Get the answers you need in no time with our AI-driven, step-by-step assistance
Get Started


