Answer question 3 please. Also, I uploaded My answer of Question 1 that is needed for Question 3.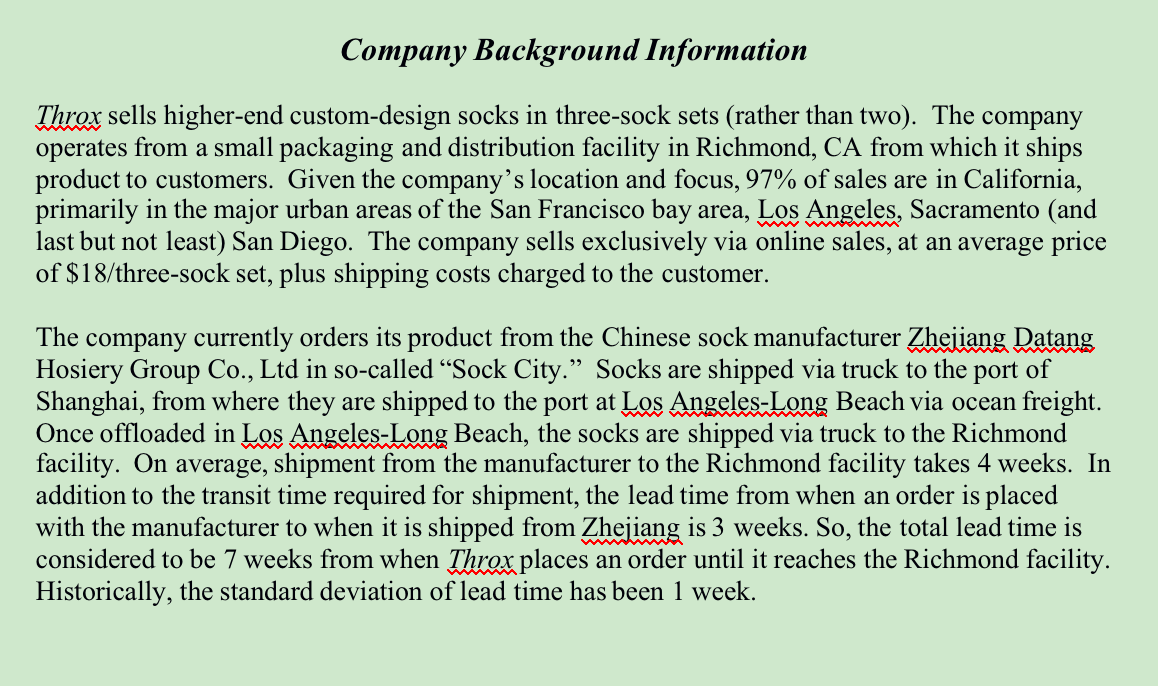
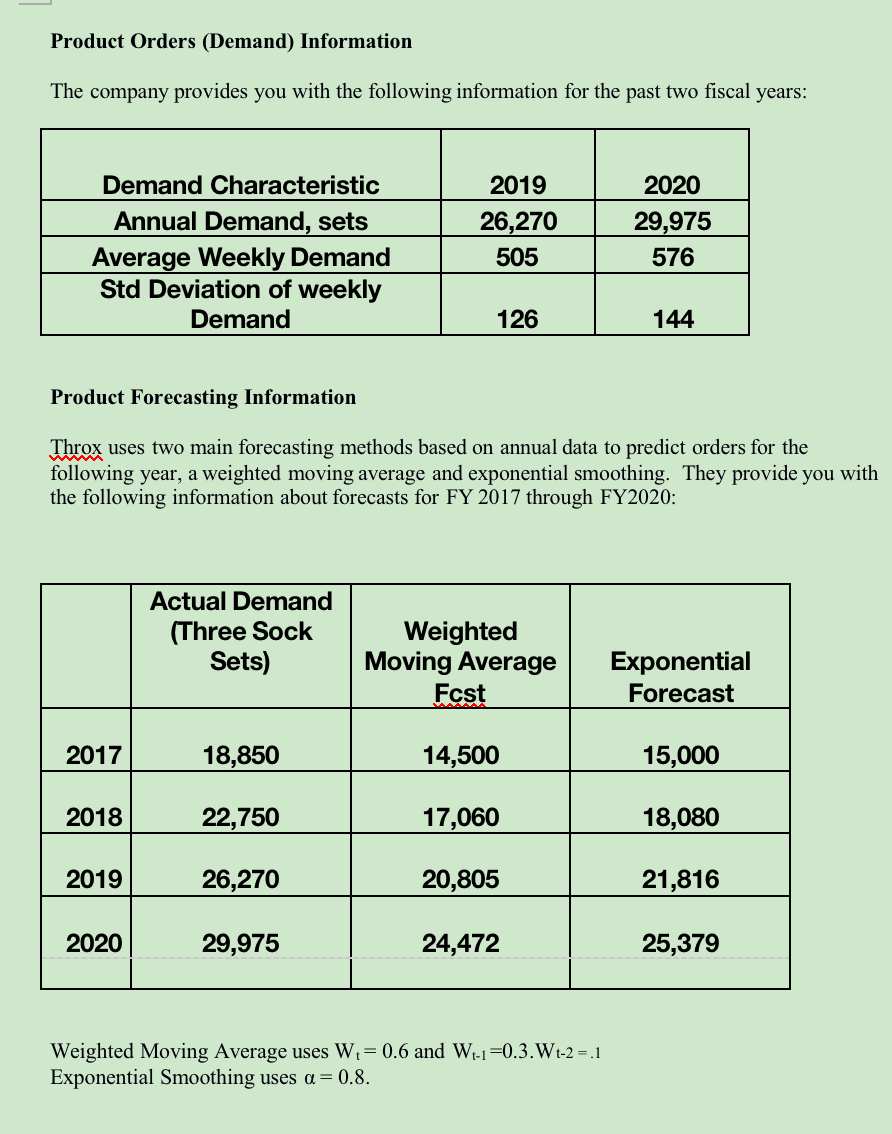
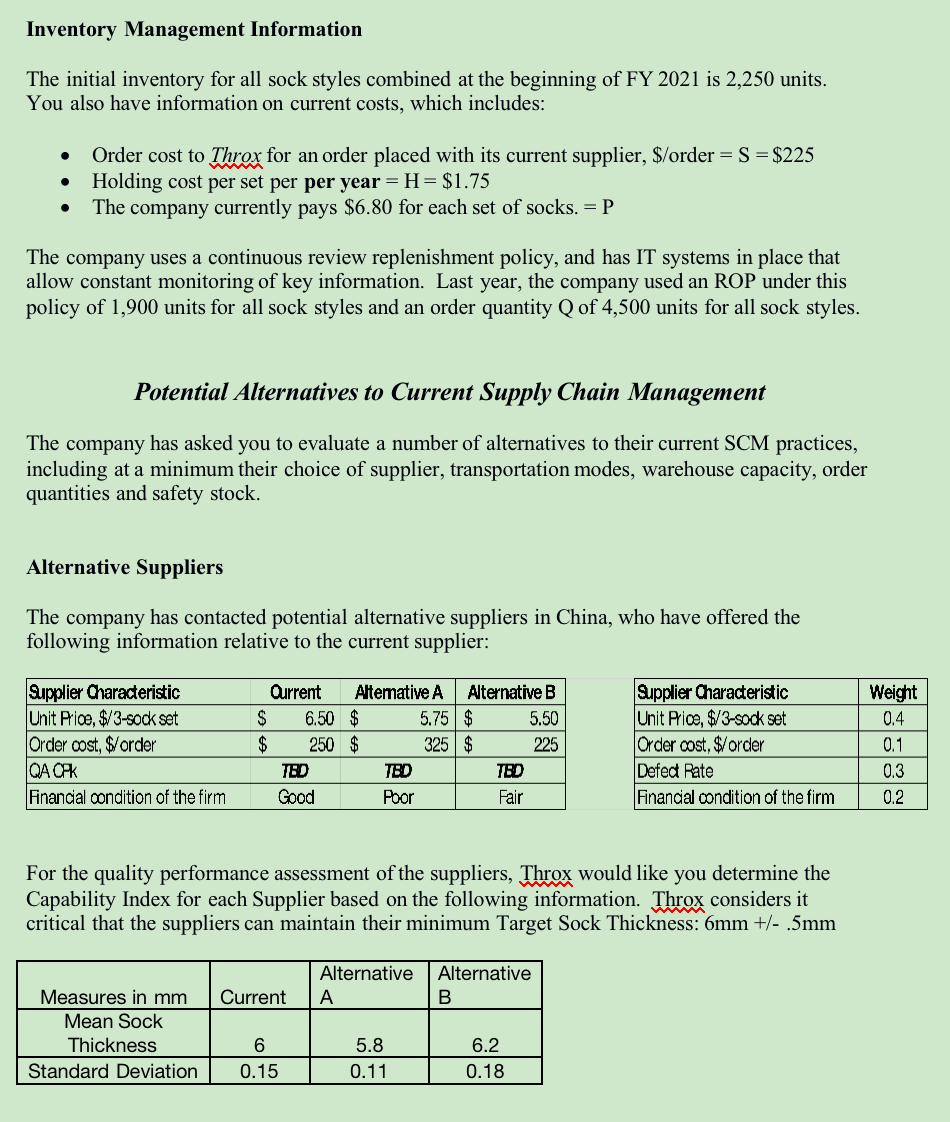
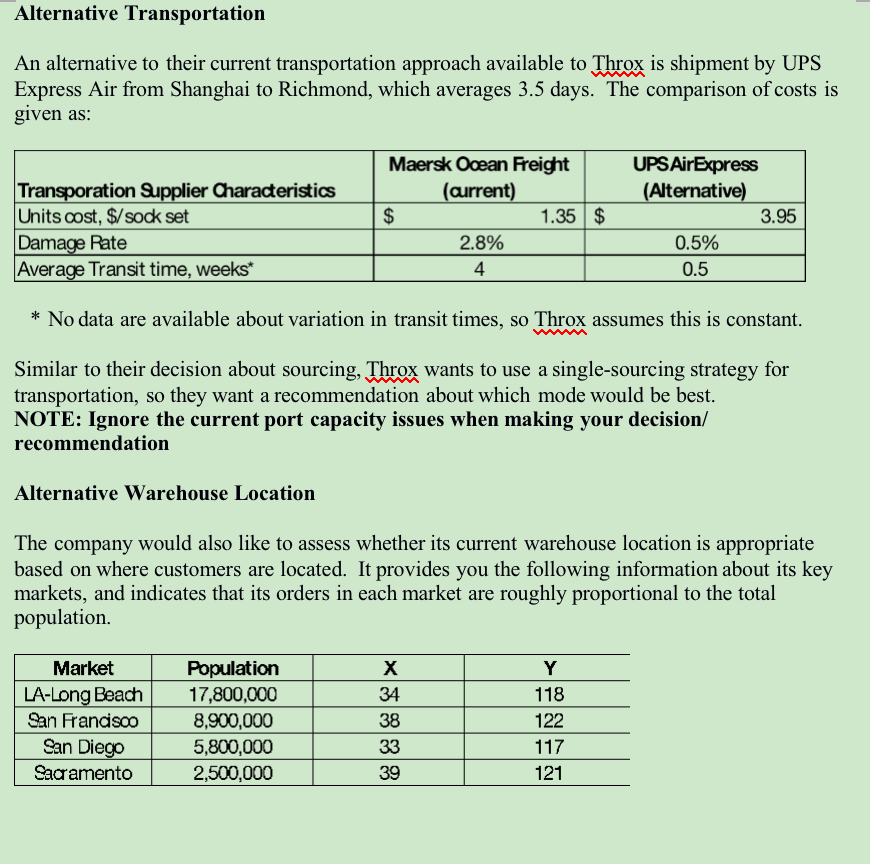
Company Background Information Throx sells higher-end custom-design socks in three-sock sets (rather than two). The company operates from a small packaging and distribution facility in Richmond, CA from which it ships product to customers. Given the company's location and focus, 97% of sales are in California, primarily in the major urban areas of the San Francisco bay area, Los Angeles, Sacramento (and last but not least) San Diego. The company sells exclusively via online sales, at an average price of $18/three-sock set, plus shipping costs charged to the customer. The company currently orders its product from the Chinese sock manufacturer Zhejiang Datang Hosiery Group Co., Ltd in so-called Sock City. Socks are shipped via truck to the port of Shanghai, from where they are shipped to the port at Los Angeles Long Beach via ocean freight. Once offloaded in Los Angeles-Long Beach, the socks are shipped via truck to the Richmond facility. On average, shipment from the m nufacturer to the Richmond facility takes heeks. In addition to the transit time required for shipment, the lead time from when an order is placed with the manufacturer to when it is shipped from Zhejiang is 3 weeks. So, the total lead time is considered to be 7 weeks from when Throx places an order until it reaches the Richmond facility. Historically, the standard deviation of lead time has been 1 week. Product Orders (Demand) Information The company provides you with the following information for the past two fiscal years: Demand Characteristic Annual Demand, sets Average Weekly Demand Std Deviation of weekly Demand 2019 26,270 505 2020 29,975 576 126 144 Product Forecasting Information Throx uses two main forecasting methods based on annual data to predict orders for the following year, a weighted moving average and exponential smoothing. They provide you with the following information about forecasts for FY 2017 through FY2020: Actual Demand (Three Sock Sets) Weighted Moving Average Fcst Exponential Forecast 2017 18,850 14,500 15,000 2018 22,750 17,060 18,080 2019 26,270 20,805 21,816 2020 29,975 24,472 25,379 Weighted Moving Average uses W = 0.6 and W-1=0.3.Wt-2 = 1 Exponential Smoothing uses a=0.8. Inventory Management Information The initial inventory for all sock styles combined at the beginning of FY 2021 is 2,250 units. You also have information on current costs, which includes: Order cost to Throx for an order placed with its current supplier, $/order = S = $225 Holding cost per set per per year = H= $1.75 The company currently pays $6.80 for each set of socks. =P The company uses a continuous review replenishment policy, and has IT systems in place that allow constant monitoring of key information. Last year, the company used an ROP under this policy of 1,900 units for all sock styles and an order quantity Q of 4,500 units for all sock styles. Potential Alternatives to Current Supply Chain Management The company has asked you to evaluate a number of alternatives to their current SCM practices, including at a minimum their choice of supplier, transportation modes, warehouse capacity, order quantities and safety stock. Alternative Suppliers The company has contacted potential alternative suppliers in China, who have offered the following information relative to the current supplier: Supplier Characteristic Unit Price, $/3-sock set Order oost, $/order QA OFK Financial condition of the firm Qurrent Alternative A Alternative B S 6.50 $ 5.75 $ 5.50 $ 250 $ 325 $ 225 TBD TBD TBD Good Poor Fair Supplier Characteristic Unit Price, $/3-sock set Order cost, $order Defed Pate Financial condition of the firm Weight 0.4 0.1 0.3 0.2 For the quality performance assessment of the suppliers, Throx would like you determine the Capability Index for each Supplier based on the following information. Throx considers it critical that the suppliers can maintain their minimum Target Sock Thickness: 6mm +/- .5mm Alternative A Alternative B Current Measures in mm Mean Sock Thickness Standard Deviation 6 0.15 5.8 0.11 6.2 0.18 Alternative Transportation An alternative to their current transportation approach available to Throx is shipment by UPS Express Air from Shanghai to Richmond, which averages 3.5 days. The comparison of costs is given as: $ Transporation Supplier Characteristics Units cost, $/sock set Damage Rate Average Transit time, weeks Maersk Ocean Freight (current) 1.35 $ 2.8% 4 UPS AirExpress (Alternative) 3.95 0.5% 0.5 * No data are available about variation in transit times, so Throx assumes this is constant. Similar to their decision about sourcing, Throx wants to use a single-sourcing strategy for transportation, so they want a recommendation about which mode would be best. NOTE: Ignore the current port capacity issues when making your decision/ recommendation Alternative Warehouse Location The company would also like to assess whether its current warehouse location is appropriate based on where customers are located. It provides you the following information about its key markets, and indicates that its orders in each market are roughly proportional to the total population. Market LA-Long Beach San Francisco San Diego Sacramento Population 17,800,000 8,900,000 5,800,000 2,500,000 X 34 38 33 39 Y 118 122 117 121 | 3) This question will have you calculating 2 different EOQ and ROP values and interpreting the results. For both EOQ and ROP, give your final answer in full sock sets (ROUND UP to the next whole number). The specific questions to answer are based in parts a-c. Tips to solve the EOQ and ROP are given below in bullet points. a) Calculate EOQ and ROP for FY2020 based on the FY2020 forecast value that you recommended in Question #1. b) Calculate the EOQ and ROP based upon actual demand for FY2020 c) Use the EOQ results from above and the Q that Throx is currently using (given in the case) and determine total inventory costs using 2020 actuals for your Demand (D). i. Compare the total inventory costs from the three results and analyze what it shows you. ii. What if any are the implications of the ROP based on the forecast and Throx current ROP vesus the ROP determined using Actual Demand. See additional tips below: Use a service level of 95% (z=1.65) when calculating the ROP z For the variance in weekly demand, use the data provided in the table on page 2 of the case with the FY2020 forecast for all approaches. Annual Inventory management costs will include the following: Annual Holding Costs, Annual Ordering Costs, and Purchase Cost. 1) Year Actual Moving Average forecast error Absolute percentage error 2017 18850 4350/18850=0.2308 14500 18850-14500= 4350 2018 22750 5690/22750=0.2501 17060 22750-17060= 5690 2019 26270 5465/26270=0.2080 20805 26270-20805= 5465 2020 29975 5503/29975=0.1836 24472 29975-24472= 5503 Then, this is the calculation of mean values Year Actual Moving Average Absolute forecast error Absolute percentage error 2017 18850 14500 4350 0.2307692308 2018 22750 17060 5690 0.2501098901 2019 26270 20805 5465 0.2080319756 2020 29975 24472 5503 0.1835863219 Mean 5252 0.2181243546 Hence, MFE is 5252; MAD is 5252; MAPE is 0.2181. Calculating errors for exponential smoothing forecasting Year Actual Exponential Absolute Absolute percentage smoothing forecast error error 2017 18850 15000 3850 0.2042440318 2018 22750 18080 4670 0.2052747253 2019 26270 21816 4454 0.1695470118 2020 29975 25379 4596 0.1533277731 Calculating the mean values Year Actual Exponential smoothing forecast Absolute error Absolute percentage error 2017 18850 15000 3850 0.2042440318 2018 22750 18080 4670 0.2052747253 2019 26270 21816 4454 0.1695470118 2020 29975 25379 4596 0.1533277731 Mean 4392.5 0.1830983855 Hence, MFE is 4392.5; MAD is 4392.5; MAPE is 0.1831. Because the value of error is very high, and the MAPE is more than 10%, these methods are inaccurate and inappropriate. 2) Moving average 3 month=0.6*29975+0.3*26270+0.1*22750 = 28141 Exponential smoothing=25379+0.8*(29975-25379) = 29055.8 Above all, exponential smoothing is a better since it has a lower MAPE Company Background Information Throx sells higher-end custom-design socks in three-sock sets (rather than two). The company operates from a small packaging and distribution facility in Richmond, CA from which it ships product to customers. Given the company's location and focus, 97% of sales are in California, primarily in the major urban areas of the San Francisco bay area, Los Angeles, Sacramento (and last but not least) San Diego. The company sells exclusively via online sales, at an average price of $18/three-sock set, plus shipping costs charged to the customer. The company currently orders its product from the Chinese sock manufacturer Zhejiang Datang Hosiery Group Co., Ltd in so-called Sock City. Socks are shipped via truck to the port of Shanghai, from where they are shipped to the port at Los Angeles Long Beach via ocean freight. Once offloaded in Los Angeles-Long Beach, the socks are shipped via truck to the Richmond facility. On average, shipment from the m nufacturer to the Richmond facility takes heeks. In addition to the transit time required for shipment, the lead time from when an order is placed with the manufacturer to when it is shipped from Zhejiang is 3 weeks. So, the total lead time is considered to be 7 weeks from when Throx places an order until it reaches the Richmond facility. Historically, the standard deviation of lead time has been 1 week. Product Orders (Demand) Information The company provides you with the following information for the past two fiscal years: Demand Characteristic Annual Demand, sets Average Weekly Demand Std Deviation of weekly Demand 2019 26,270 505 2020 29,975 576 126 144 Product Forecasting Information Throx uses two main forecasting methods based on annual data to predict orders for the following year, a weighted moving average and exponential smoothing. They provide you with the following information about forecasts for FY 2017 through FY2020: Actual Demand (Three Sock Sets) Weighted Moving Average Fcst Exponential Forecast 2017 18,850 14,500 15,000 2018 22,750 17,060 18,080 2019 26,270 20,805 21,816 2020 29,975 24,472 25,379 Weighted Moving Average uses W = 0.6 and W-1=0.3.Wt-2 = 1 Exponential Smoothing uses a=0.8. Inventory Management Information The initial inventory for all sock styles combined at the beginning of FY 2021 is 2,250 units. You also have information on current costs, which includes: Order cost to Throx for an order placed with its current supplier, $/order = S = $225 Holding cost per set per per year = H= $1.75 The company currently pays $6.80 for each set of socks. =P The company uses a continuous review replenishment policy, and has IT systems in place that allow constant monitoring of key information. Last year, the company used an ROP under this policy of 1,900 units for all sock styles and an order quantity Q of 4,500 units for all sock styles. Potential Alternatives to Current Supply Chain Management The company has asked you to evaluate a number of alternatives to their current SCM practices, including at a minimum their choice of supplier, transportation modes, warehouse capacity, order quantities and safety stock. Alternative Suppliers The company has contacted potential alternative suppliers in China, who have offered the following information relative to the current supplier: Supplier Characteristic Unit Price, $/3-sock set Order oost, $/order QA OFK Financial condition of the firm Qurrent Alternative A Alternative B S 6.50 $ 5.75 $ 5.50 $ 250 $ 325 $ 225 TBD TBD TBD Good Poor Fair Supplier Characteristic Unit Price, $/3-sock set Order cost, $order Defed Pate Financial condition of the firm Weight 0.4 0.1 0.3 0.2 For the quality performance assessment of the suppliers, Throx would like you determine the Capability Index for each Supplier based on the following information. Throx considers it critical that the suppliers can maintain their minimum Target Sock Thickness: 6mm +/- .5mm Alternative A Alternative B Current Measures in mm Mean Sock Thickness Standard Deviation 6 0.15 5.8 0.11 6.2 0.18 Alternative Transportation An alternative to their current transportation approach available to Throx is shipment by UPS Express Air from Shanghai to Richmond, which averages 3.5 days. The comparison of costs is given as: $ Transporation Supplier Characteristics Units cost, $/sock set Damage Rate Average Transit time, weeks Maersk Ocean Freight (current) 1.35 $ 2.8% 4 UPS AirExpress (Alternative) 3.95 0.5% 0.5 * No data are available about variation in transit times, so Throx assumes this is constant. Similar to their decision about sourcing, Throx wants to use a single-sourcing strategy for transportation, so they want a recommendation about which mode would be best. NOTE: Ignore the current port capacity issues when making your decision/ recommendation Alternative Warehouse Location The company would also like to assess whether its current warehouse location is appropriate based on where customers are located. It provides you the following information about its key markets, and indicates that its orders in each market are roughly proportional to the total population. Market LA-Long Beach San Francisco San Diego Sacramento Population 17,800,000 8,900,000 5,800,000 2,500,000 X 34 38 33 39 Y 118 122 117 121 | 3) This question will have you calculating 2 different EOQ and ROP values and interpreting the results. For both EOQ and ROP, give your final answer in full sock sets (ROUND UP to the next whole number). The specific questions to answer are based in parts a-c. Tips to solve the EOQ and ROP are given below in bullet points. a) Calculate EOQ and ROP for FY2020 based on the FY2020 forecast value that you recommended in Question #1. b) Calculate the EOQ and ROP based upon actual demand for FY2020 c) Use the EOQ results from above and the Q that Throx is currently using (given in the case) and determine total inventory costs using 2020 actuals for your Demand (D). i. Compare the total inventory costs from the three results and analyze what it shows you. ii. What if any are the implications of the ROP based on the forecast and Throx current ROP vesus the ROP determined using Actual Demand. See additional tips below: Use a service level of 95% (z=1.65) when calculating the ROP z For the variance in weekly demand, use the data provided in the table on page 2 of the case with the FY2020 forecast for all approaches. Annual Inventory management costs will include the following: Annual Holding Costs, Annual Ordering Costs, and Purchase Cost. 1) Year Actual Moving Average forecast error Absolute percentage error 2017 18850 4350/18850=0.2308 14500 18850-14500= 4350 2018 22750 5690/22750=0.2501 17060 22750-17060= 5690 2019 26270 5465/26270=0.2080 20805 26270-20805= 5465 2020 29975 5503/29975=0.1836 24472 29975-24472= 5503 Then, this is the calculation of mean values Year Actual Moving Average Absolute forecast error Absolute percentage error 2017 18850 14500 4350 0.2307692308 2018 22750 17060 5690 0.2501098901 2019 26270 20805 5465 0.2080319756 2020 29975 24472 5503 0.1835863219 Mean 5252 0.2181243546 Hence, MFE is 5252; MAD is 5252; MAPE is 0.2181. Calculating errors for exponential smoothing forecasting Year Actual Exponential Absolute Absolute percentage smoothing forecast error error 2017 18850 15000 3850 0.2042440318 2018 22750 18080 4670 0.2052747253 2019 26270 21816 4454 0.1695470118 2020 29975 25379 4596 0.1533277731 Calculating the mean values Year Actual Exponential smoothing forecast Absolute error Absolute percentage error 2017 18850 15000 3850 0.2042440318 2018 22750 18080 4670 0.2052747253 2019 26270 21816 4454 0.1695470118 2020 29975 25379 4596 0.1533277731 Mean 4392.5 0.1830983855 Hence, MFE is 4392.5; MAD is 4392.5; MAPE is 0.1831. Because the value of error is very high, and the MAPE is more than 10%, these methods are inaccurate and inappropriate. 2) Moving average 3 month=0.6*29975+0.3*26270+0.1*22750 = 28141 Exponential smoothing=25379+0.8*(29975-25379) = 29055.8 Above all, exponential smoothing is a better since it has a lower MAPE