Answer table 3, guide questions, analysis and conclusion. pls refer to this link: https://drive.google.com/file/d/1kIwX35v3GHjnBLpKkgcuJ_n_8YohRofJ/view?usp=drivesdk or https://docs.google.com/file/d/1gUZ_5w5t0AowwSdWPnmXcnC2F5ltg0jV/edit?usp=docslist_api&filetype=msword thanks GUIDE QUESTIONS I. The acceleration of the cartpulleyhanging
Answer table 3, guide questions, analysis and conclusion.
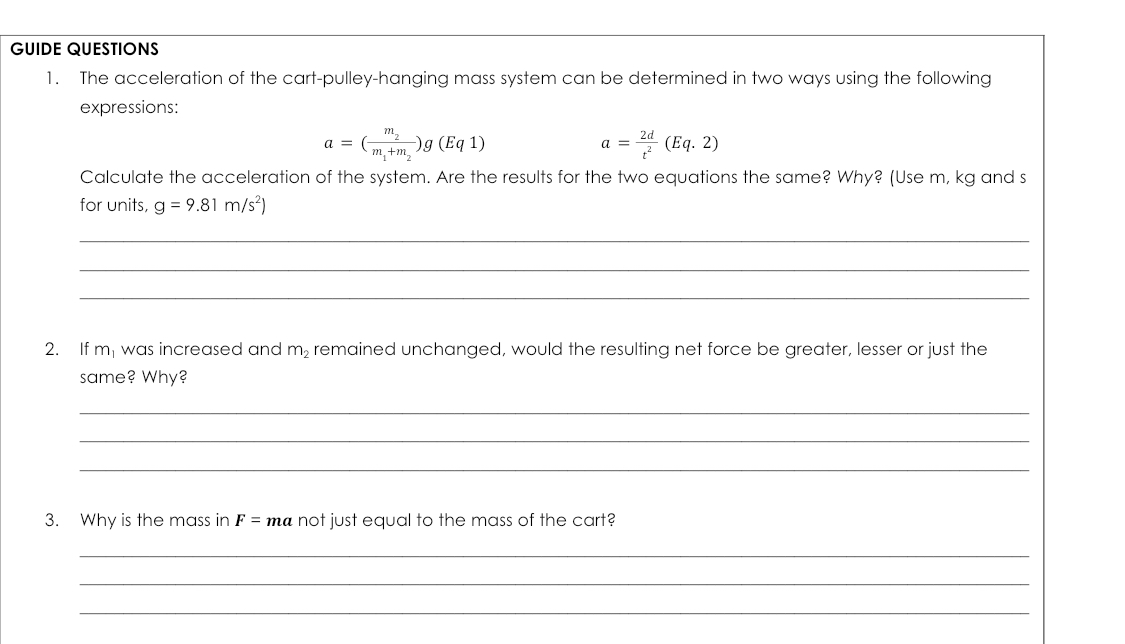
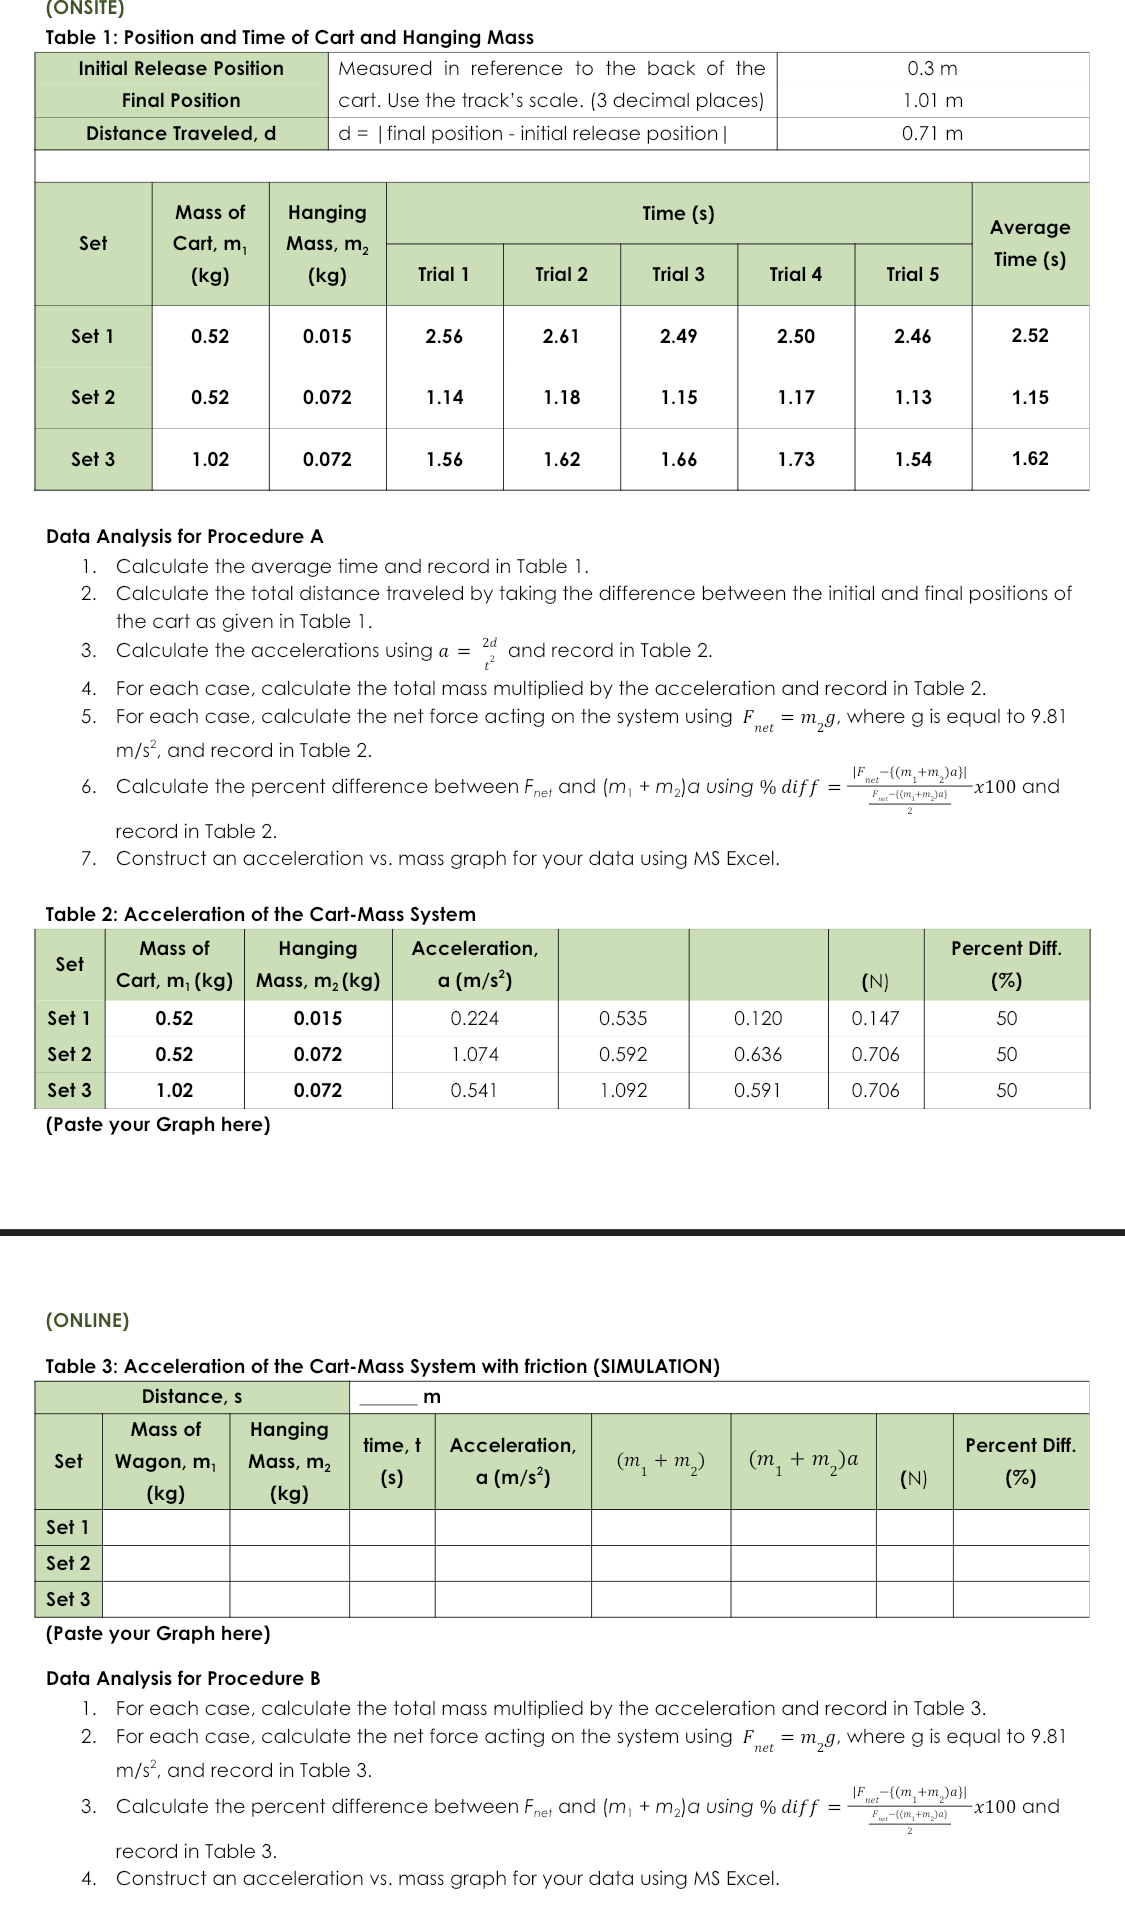
GUIDE QUESTIONS I. The acceleration of the cartpulleyhanging mass system can be determined in two ways using the following expressions: a = (may (Eq 1) a = :f (Eq- 2) Calculate the acceleration of the system. Are the results for the two equations the same? Why? [Use In. kg and s for units, 9 = 9.8] mfszl 2. If m was increased and m2 remained unchanged. would the resulting net force be greater. lesser or just the same? Why? 3. Why is the mass in F = ma not just equal to the mass of the cart? Analysis: {Examine your data. exptain why they occurred. and interpret what they mean in relation to the objectives. Check your data against your hypothesis and find out whether it is supported or contradicted. Cite scientific concepts, tows. or principles to exptain your data. You may construct a graph to show the retationship among the data obtained.) Application [Cite 23 applications at the scientific concepts that you have learned in this experiment] (ONSITE) Table 1: Position and Time of Cart and Hanging Mass Initial Release Position Measured in reference to the back of the 0.3 m Final Position cart. Use the track's scale. (3 decimal places) 1.01 m Distance Traveled, d d = | final position - initial release position | 0.71 m Mass of Hanging Time (s) Average Set Cart, m, Mass, m2 Trial 2 Trial 4 Trial 5 Time (s) (kg) (kg) Trial 1 Trial 3 Set 1 0.52 0.015 2.56 2.61 2.49 2.50 2.46 2.52 Set 2 0.52 0.072 1.14 1.18 1.15 1.17 1.13 1.15 Set 3 1.02 0.072 1.56 1.62 1.66 1.73 1.54 1.62 Data Analysis for Procedure A 1. Calculate the average time and record in Table 1. 2. Calculate the total distance traveled by taking the difference between the initial and final positions of the cart as given in Table 1. 3. Calculate the accelerations using a = " and record in Table 2. 4. For each case, calculate the total mass multiplied by the acceleration and record in Table 2. 5. For each case, calculate the net force acting on the system using F = m,g, where g is equal to 9.81 m/s, and record in Table 2. 6. Calculate the percent difference between Fe, and (m, + m,)a using % diff =- -IFnet ((m, +m, )all ner -((m, +m, )a ) x100 and record in Table 2. 7. Construct an acceleration vs. mass graph for your data using MS Excel. Table 2: Acceleration of the Cart-Mass System Mass of Hanging Acceleration, Percent Diff. Set Cart, m, (kg) Mass, m2 (kg) a (m/s?) (N) () Set 1 0.52 0.015 0.224 0.535 0.120 0.147 50 Set 2 0.52 0.072 1.074 0.592 0.636 0.706 50 Set 3 1.02 0.072 0.541 1.092 0.591 0.706 50 (Paste your Graph here) (ONLINE) Table 3: Acceleration of the Cart-Mass System with friction (SIMULATION) Distance, s m Mass of Hanging time, t Acceleration, Percent Diff. Set Wagon, m, Mass, m2 ( m +m ) (m + m )a (s) a (m/s? ) (N) (%) (kg) (kg) Set 1 Set 2 Set 3 (Paste your Graph here) Data Analysis for Procedure B For each case, calculate the total mass multiplied by the acceleration and record in Table 3. 2. For each case, calculate the net force acting on the system using F = m,g, where g is equal to 9.81 m/s', and record in Table 3. 3. Calculate the percent difference between Fe, and (m, + m2)a using % diff =- IF net -((m, +m )all Fever -((m, +m, )a) x100 and record in Table 3. 4. Construct an acceleration vs. mass graph for your data using MS Excel
Step by Step Solution
There are 3 Steps involved in it
Step: 1
Get Instant Access to Expert-Tailored Solutions
See step-by-step solutions with expert insights and AI powered tools for academic success
Step: 2
Step: 3
Ace Your Homework with AI
Get the answers you need in no time with our AI-driven, step-by-step assistance