

Answered step by step
Verified Expert Solution
Question
1 Approved Answer
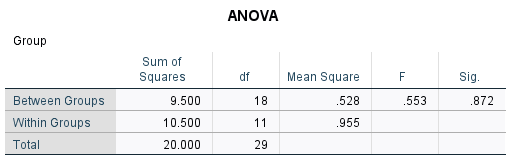
Answer the below questions (5) based on the tables (statistics) provided below, preferably in paragraphs. Interpret the results of the statistical analysis (do you reject
Answer the below questions (5) based on the tables (statistics) provided below, preferably in paragraphs.
- Interpret the results of the statistical analysis (do you reject the null; do you accept the null?). Explain in lay terms what rejecting/accepting the null means in your case.
- Look at the means of each group. Is this what you expected the outcome to be? Why or why not?
- What additional tests should be run to further determine which of the means are different from each other? Did SPSS run those tests? What can you ascertain about which means are different from each other and why?
- Describe your statistical results in narrative (sentence) form for the problem for the results.
- What are some limitations of using the outcome of these test results? What might some additional variables be that weren't accounted for? Is this sample size powerful enough to make a determination about the larger population?
Step by Step Solution
There are 3 Steps involved in it
Step: 1

Get Instant Access to Expert-Tailored Solutions
See step-by-step solutions with expert insights and AI powered tools for academic success
Step: 2

Step: 3
Ace Your Homework with AI
Get the answers you need in no time with our AI-driven, step-by-step assistance
Get Started
Linear Algebra A Modern Introduction
Authors: David Poole
3rd edition
9781133169574 , 978-0538735452