answer the following: Question 2 The data below shows the LSAT scores of 30 students at Georgetown University in Massachusetts. 1561 1554 1536 1531 1523
answer the following:
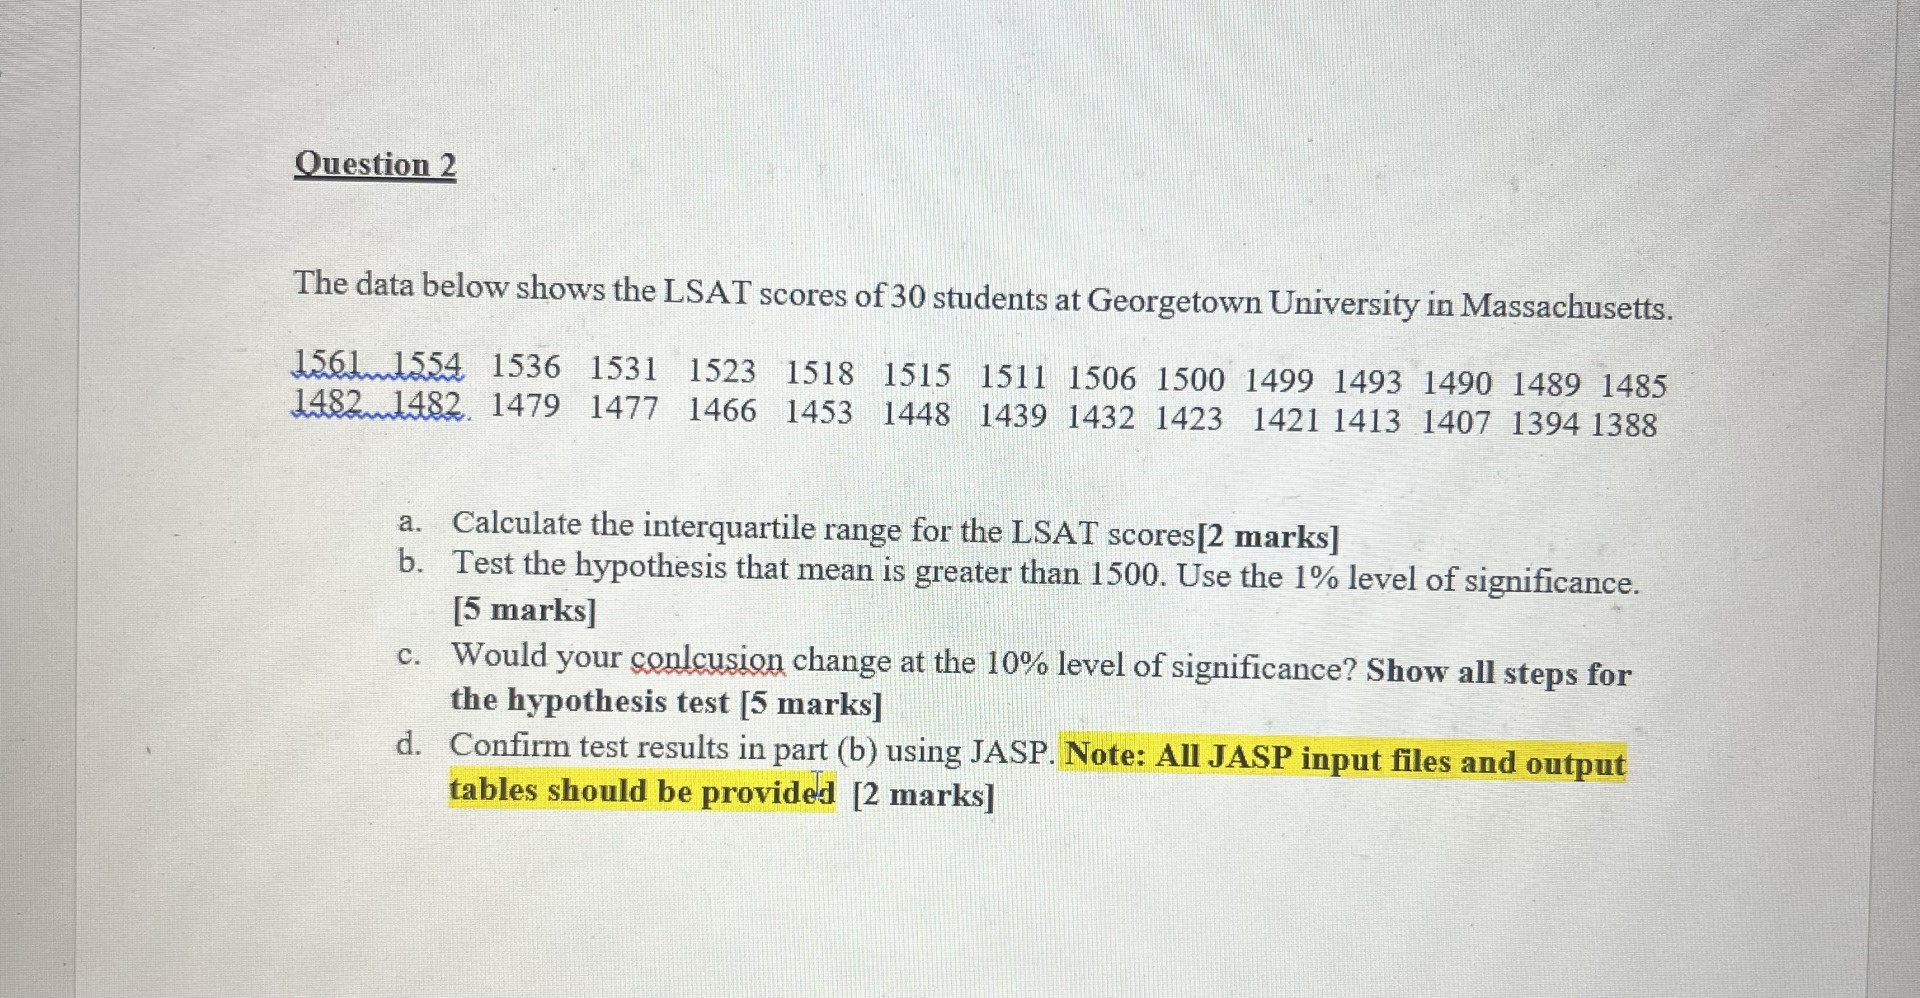
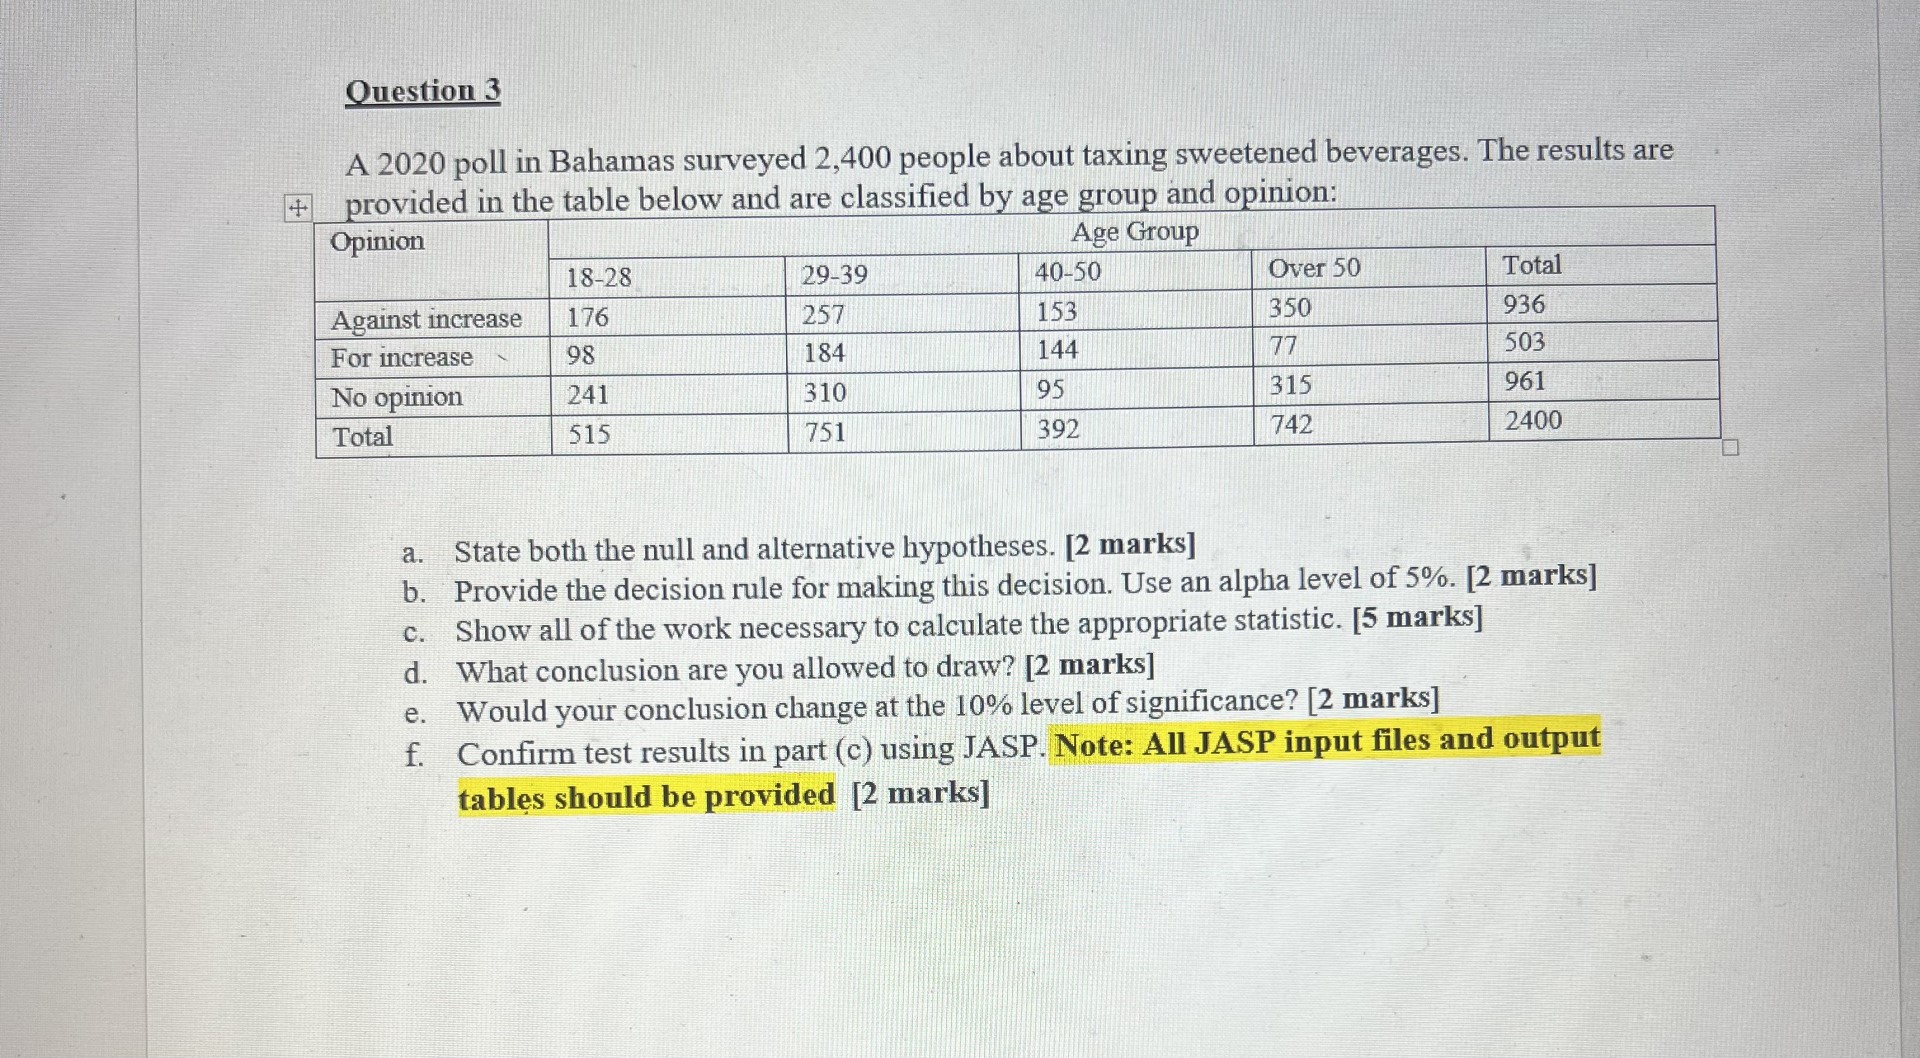
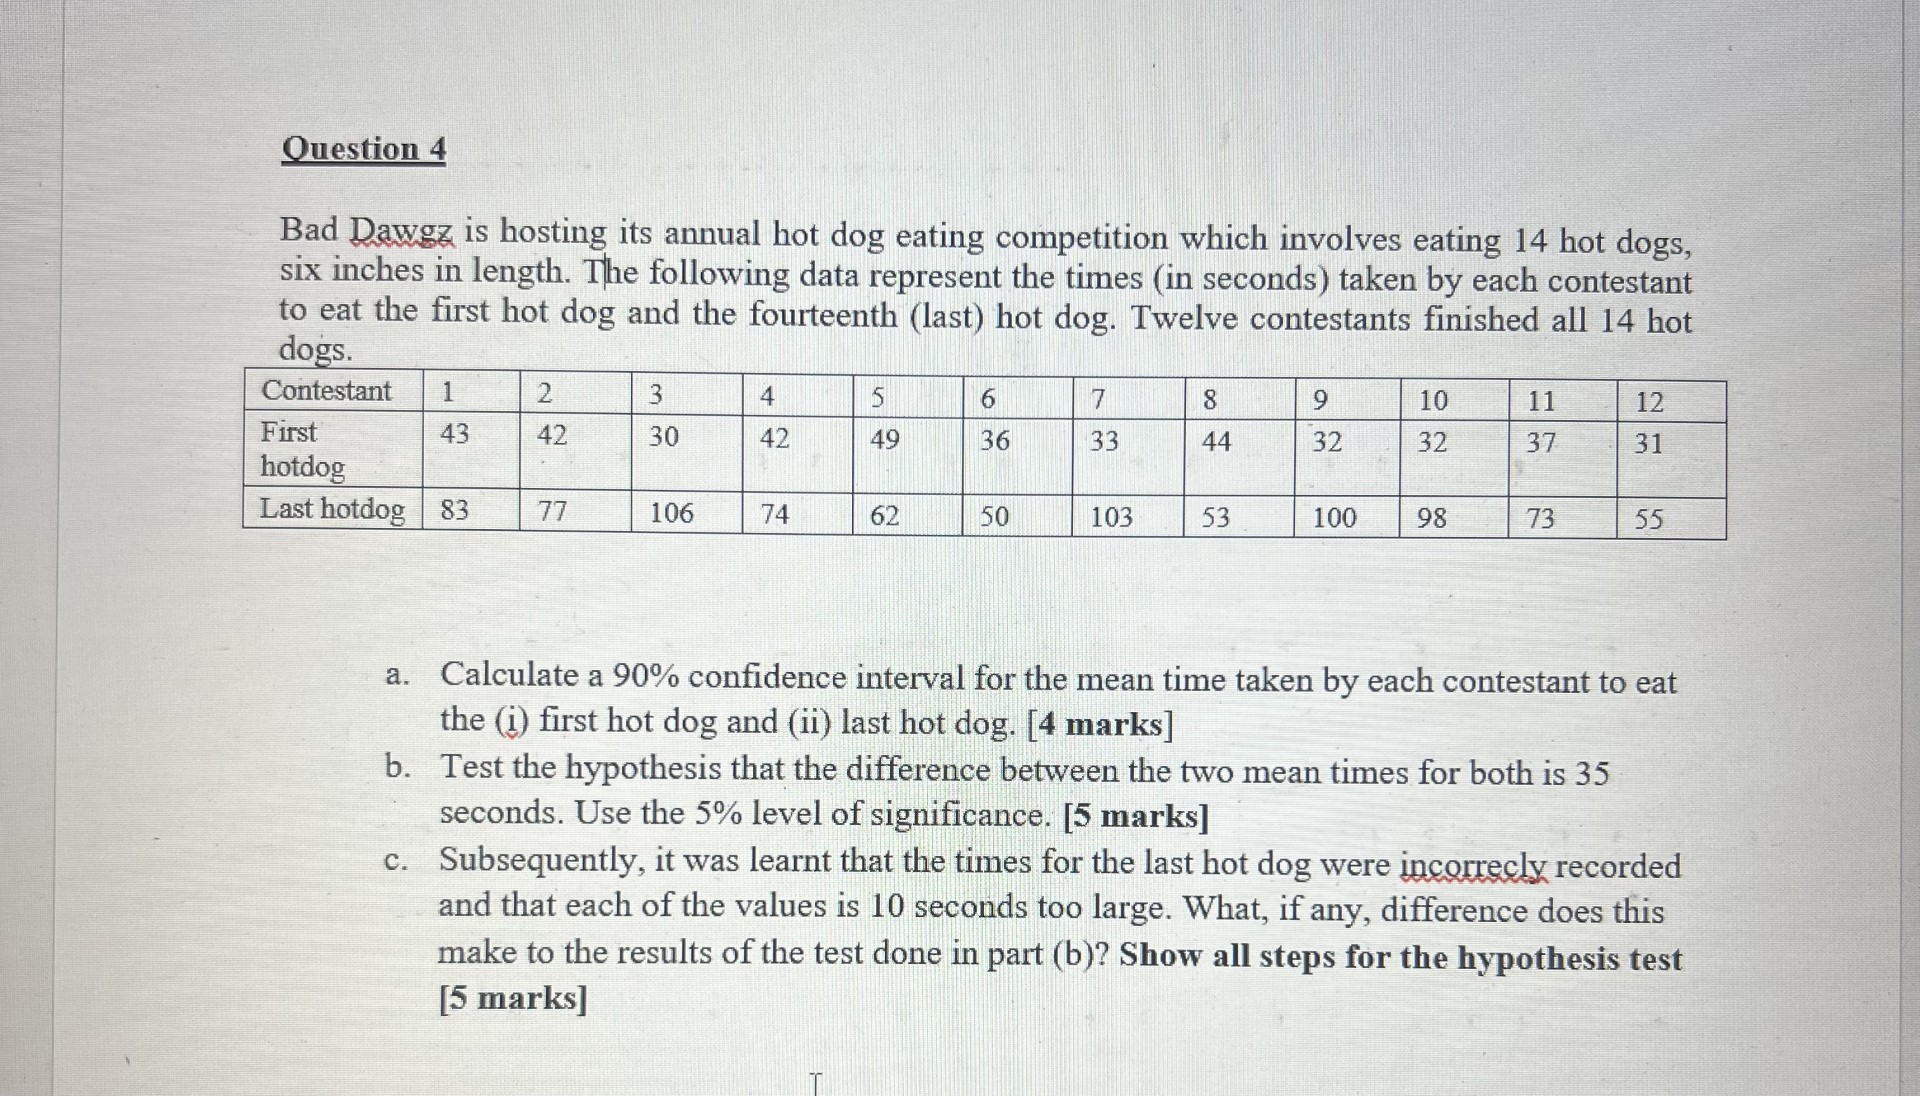
Question 2 The data below shows the LSAT scores of 30 students at Georgetown University in Massachusetts. 1561 1554 1536 1531 1523 1518 1515 1511 1506 1500 1499 1493 1490 1489 1485 1482 1482, 1479 1477 1466 1453 1448 1439 1432 1423 1421 1413 1407 1394 1388 a. Calculate the interquartile range for the LSAT scores [2 marks] b. Test the hypothesis that mean is greater than 1500. Use the 1% level of significance. [5 marks] c. Would your conlcusion change at the 10% level of significance? Show all steps for the hypothesis test [5 marks] d. Confirm test results in part (b) using JASP. Note: All JASP input files and output tables should be provided [2 marks]Question 3 A 2020 poll in Bahamas surveyed 2,400 people about taxing sweetened beverages. The results are provided in the table below and are classified by age group and opinion: Opinion Age Group 18-28 29-39 40-50 Over 50 Total Against increase 176 257 153 350 936 For increase 98 184 144 77 503 No opinion 241 310 95 315 961 Total 515 751 392 742 2400 a. State both the null and alternative hypotheses. [2 marks] b. Provide the decision rule for making this decision. Use an alpha level of 5%. [2 marks] c. Show all of the work necessary to calculate the appropriate statistic. [5 marks] d. What conclusion are you allowed to draw? [2 marks] e. Would your conclusion change at the 10% level of significance? [2 marks] f. Confirm test results in part (c) using JASP. Note: All JASP input files and output tables should be provided [2 marks]Question 4 Bad Dawgz is hosting its annual hot dog eating competition which involves eating 14 hot dogs, six inches in length. The following data represent the times (in seconds) taken by each contestant to eat the first hot dog and the fourteenth (last) hot dog. Twelve contestants finished all 14 hot dogs. Contestant 1 2 3 4 5 6 7 8 9 10 11 12 First 43 42 30 42 49 36 33 44 32 32 37 31 hotdog Last hotdog 83 77 106 74 62 50 103 53 100 98 73 55 a. Calculate a 90% confidence interval for the mean time taken by each contestant to eat the (i) first hot dog and (ii) last hot dog. [4 marks] b. Test the hypothesis that the difference between the two mean times for both is 35 seconds. Use the 5% level of significance. [5 marks] c. Subsequently, it was learnt that the times for the last hot dog were incorrecly recorded and that each of the values is 10 seconds too large. What, if any, difference does this make to the results of the test done in part (b)? Show all steps for the hypothesis test [5 marks]
Step by Step Solution
There are 3 Steps involved in it
Step: 1
Get Instant Access to Expert-Tailored Solutions
See step-by-step solutions with expert insights and AI powered tools for academic success
Step: 2
Step: 3
Ace Your Homework with AI
Get the answers you need in no time with our AI-driven, step-by-step assistance