Answered step by step
Verified Expert Solution
Question
1 Approved Answer
Answer the following questions using the data from the value line and/or company financials. and provides access ts its other service offerings. The Corepasy offers
Answer the following questions using the data from the value line and/or company financials. 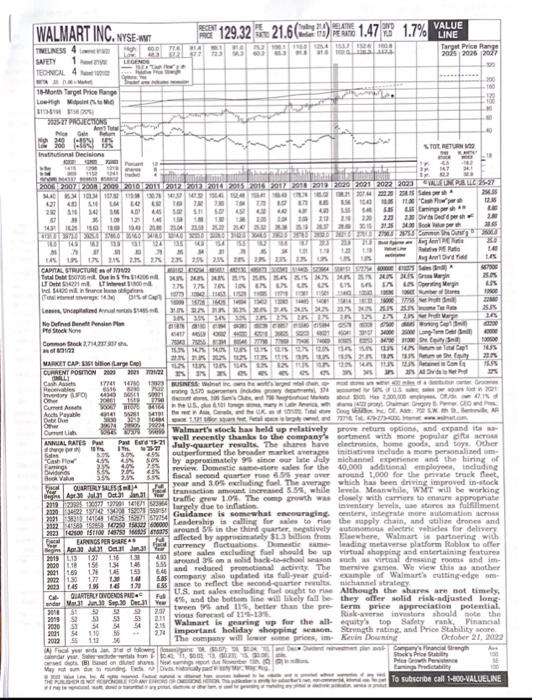
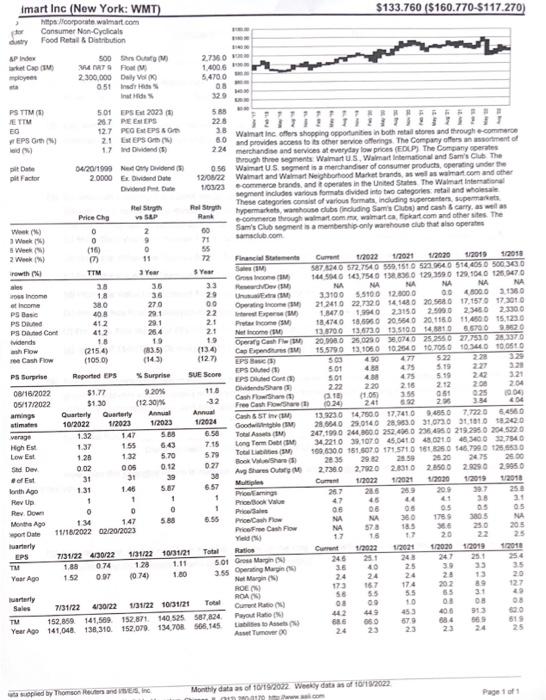
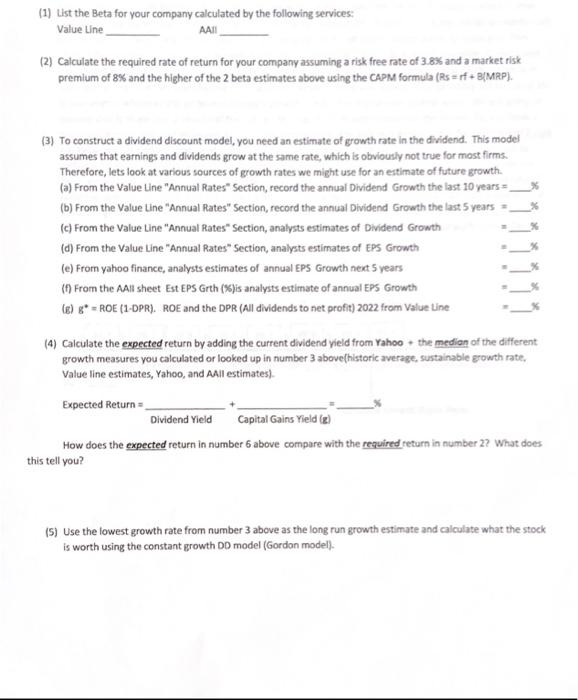
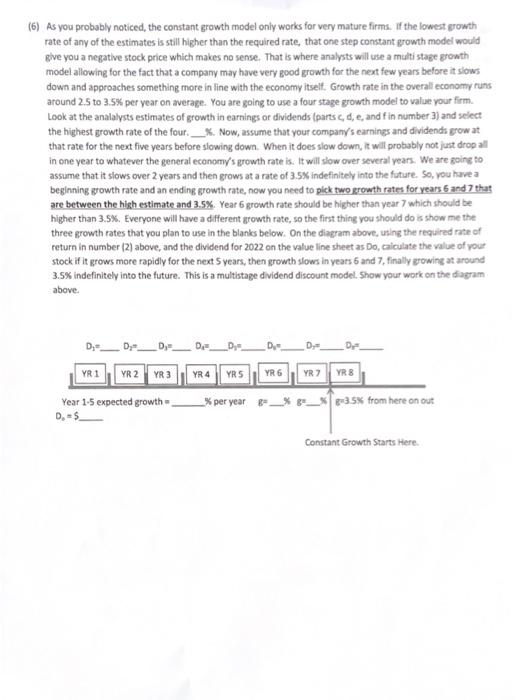
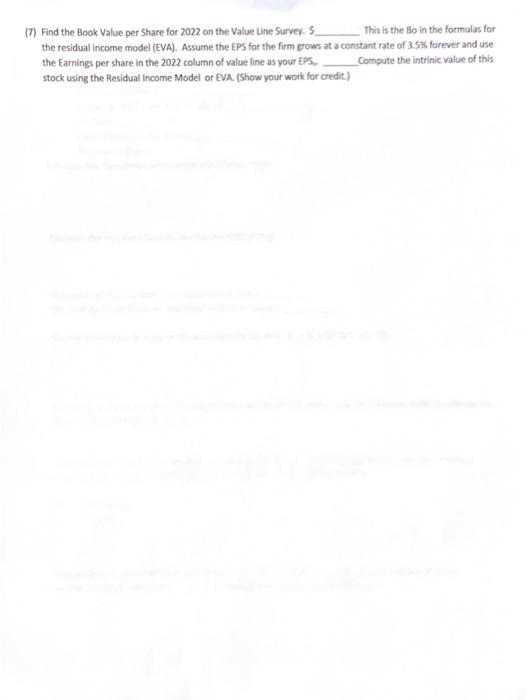
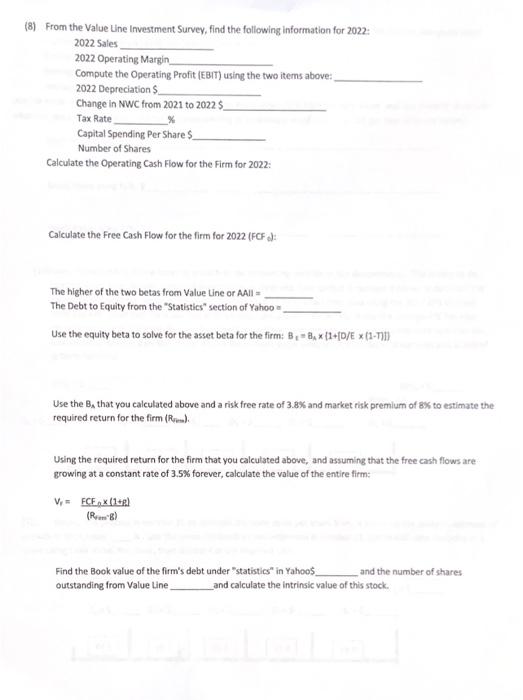
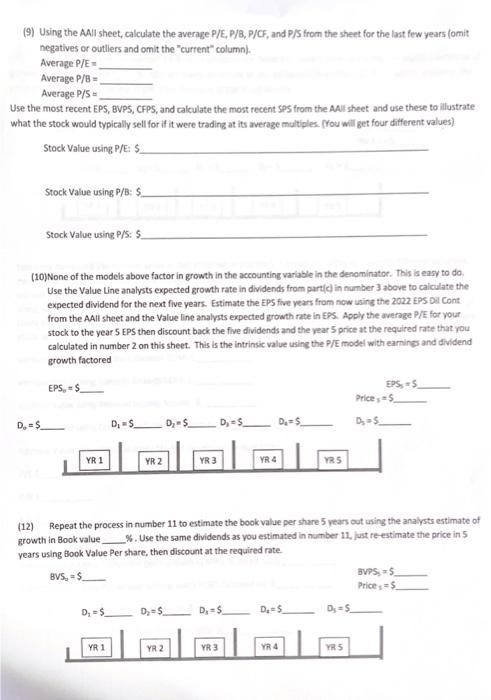
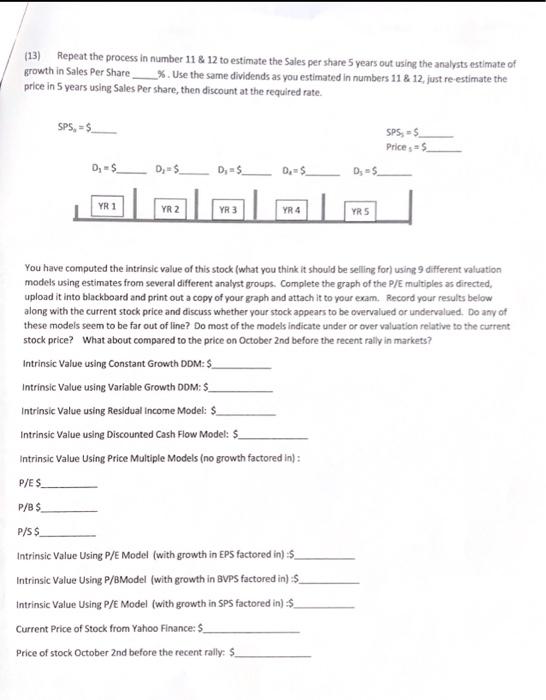
and provides access ts its other service offerings. The Corepasy offers an assortment of merchandite and services at everytay low prices (FDU.P) The Conpany ocerates besugh theee segments. Waimat U.S. Vaimart letematich al and Sam's Club. The Waitart US. segment is a mertandisar of consumer producta, cperating undet toe Wainart and WVarmat Neighboitiood Macket srands, as well as wairaf cora and other segment incluses vaross formata divided into two categories: retail and whoiesain These categories contist of various formats, incluting supercertern, supstraivets typermarkets, warchouse clubs (ircluding Samis Cubt) and cash 8 carry, as weth as 6-commeice through walmat com mic, waimart ea, fipkart eom and other stes. The Sam's Club sogment a a memterabig-only marehouse club that aise operates saintelvibom. (2) Calculate the required rate of return for your company assuming a risk free rate of 3.8% and a market risk premium of 8% and the higher of the 2 beta estimates above using the CAPM formula (Rs=rf+B\MRP). (3) To construct a dividend discount model, you need an estimate of growth rate in the dividend. This model assumes that earnings and dividends grow at the same rate, which is obviously not true for most firms. Therefore, lets look at various sources of growth rates we might use for an estimate of future growth. (a) From the Value Line "Annual Rates" Section, record the annual Dividend Growth the last 10 years = (b) From the Value Line "Annual Rates" Section, record the annual Dividend Growth the last 5 years = (c) From the Value Line "Annual Rates" Section, analysts estimates of Dividend Gro (d) From the Value Line "Annual Rates" Section, analysts estimates of EPS Growth (e) From yahoo finance, analysts estimates of annual EPS Growth next 5 years (f) From the AAll sheet Est EPS Grth (\%)is analysts estimate of annual EPS Growth (g) g= ROE (1-DPR). ROE and the DPR (Al dividends to net profit) 2022 from Value Line (4) Calculate the expected return by adding the current dividend vield from Yahoo + the medion of the different growth measures you calculated or looked up in number 3 above(historic average, sustainable growth rate, Value line estimates, Yahoo, and AAll estimates). Expected Return =DividendYield+CapitalGainsYield(z)= How does the expected return in number 6 above compare with the required return in number 2? What does this tell you? (S) Use the lowest growth rate from number 3 above as the long run growth estimate and calculate what the stock is worth using the constant growth DD model (Gordon model). (6) As you probably noticed, the constant growth model only works for very mature firms. If the lowest growth rate of any of the estimates is still higher than the required rate, that one step constant growth model would give you a negative stock price which makes no sense. That is where analysts will use a multi stage growth model allowing for the fact that a company may have very good growth for the next few years before it slows down and approaches something more in line with the economy itself. Growth rate in the overall economy runs around 2.5 to 3.5% per year on average. You are going to use a four stage growth model to value your firm. Look at the analalysts estimates of growth in earnings of dividends (parts c,d,, and f in number 3 ) and select the highest growth rate of the four. \%. Now, assume that your company's carnings and dividends grow at that rate for the next five years before slowing down. When it does slow down, it will probably not just drop all in one year to whatever the general economy's growt rate is. It will slow over several years. We are going to assume that it slows over 2 years and then grows at a rate of 3.5K indefinitely inte the future. So, you have a beginning growth rate and an ending growth rate, now you need to pick two growth rates for years 6 and 7 that are between the high estimate and 3.5%. Year 6 growth rate should be higher than year 7 which should be higher than 3.5\%. Everyone will have a different growth rate, so the first thing you should do is show me the three growth rates that you plan to use in the blanks below. On the diagram above, using the required rate of return in number (2) above, and the dividend for 2022 on the value line sheet as Do, calculate the value of your stock if it grows more rapidly for the nect 5 years, then growth slows in years 6 and 7 , finally growing at around 3.5% indefinitely into the future. This is a multistage dividend discount model, Show your work an the diagram above. (7) Find the Book Value per Share for 2022 on the Value Line Surver. 5 . This is the Bo in the formulas for the residual income model (EVA). Assume the EPS for the firm erows at a constant rate of 3.5% forever and use the Earnings per share in the 2022 column of value line as your EPS, Compute the intrinic value of this stock using the Residual Income Model or EVA. (Show your work for credit.) (8) From the Value Une Investment Survey, find the following information for 2022 : 2022 Sales 2022 Operating Margin Compute the Operating Profit (EBIT) using the two items above: 2022 Depreciation $ Change in NWC from 2021 to 20225 Tax Rate Capital Spending Per Share $ Number of Shares Calculate the Operating Cash Flow for the Firm for 2022: Calculate the Free Cash Flow for the firm for 2022 (FCF d): The higher of the two betas from Value Line or AAll = The Debt to Equity from the " "Statistics" section of Yahoo a Use the equity beta to solve for the asset beta for the firm: B1=BA(1+[D/E(1T)]) Use the Ba that you calculated above and a risk free rate of 3.8% and market risk premium of Bx to estimate the required return for the firm (Rres). Using the required return for the firm that you calculated above, and assuming that the free cash flows are growing at a constant rate of 3.5% forever, calculate the value of the entire firm: V1=(RnmB)FCFn(1+g) Find the Book value of the firm's debt under "statistics" in Yahoos and the number of shares outstanding from Value Line and calculate the intrinsic value of this stock. (9) Using the AAll sheet, calculate the average P/E, P/B, P/CF, and P/S from the sheet for the last few years (omit negatives or outliers and omit the "current" column). Average P/E = Average P/B= Average P/S = Use the most recent EPS, BVPS, CFPS, and calculate the most recent SPS from the AMll sheet and use these to illustrate what the stock would typically sell for if it were trading at its average multiples. (frou will get four different values) Stock Value using P/E: $ Stock Value using P/B: 5 Stock Value using P/S: $ (10) None of the models above factor in growth in the accounting variable in the denominator. This is easy to do. Use the Value Line analysts expected growth rate in dividends from particl in number 3 above to calculate the expected dividend for the next five years. Estimate the EPS five years from now using the 2022 EPS Dil Cont from the AAll sheet and the Value line analysts expected growth rate in EPS. Apply the werage P/E for your stock to the year 5 EPS then discount back the five dividends and the year 5 price at the required rate that you calculated in number 2 on this sheet. This is the intrinsic value using the P/E model with earning and dividend growth factored (12) Repeat the process in number 11 to estimate the book value per share 5 years out uning the analysts estimate of growth in Book value %. Use the same dividends as you estimated in number 11, just re estimate the price in 5 years using Book Value Per share, then discount at the required rate. (13) Repeat the process in number 11&12 to estimate the Sales per share 5 years out using the analysts estimate of growth in Sales Per Share \%. Use the same dividends as you estimated in numbers 11&12, just re estimate the price in 5 years using Sales Per share, then discount at the required rate. SPS=$ You have computed the intrinsic value of this stock (what you think it should be selling for) using 9 different valuation models using estimates from several different analyst groups. Complete the graph of the P/E multiples as directed, upload it into blackboard and print out a copy of your graph and attach it to your exam. Record your results below along with the current stock price and discuss whether your stock appears to be overvalued or undervalued. Do any of these models seem to be far out of line? Do most of the models indicate under or over valuation relative to the current stock price? What about compared to the price on October 2 nd before the recent rally in markets? Intrinsic Value using Constant Growth DDM: $ Intrinsic Value using Variable Growth DDM: \$ Intrinsic Value using Residual income Model: \$\$ Intrinsic Value using Discounted Cash Flow Model: $ Intrinsic Value Using Price Multiple Models (no growth factored in) : P/E S P/B$ P/S$ Intrinsic Value Using P/E Model (with growth in EPS factored in) : $. Intrinsic Value Using P/BModel (with growth in BVPS factored in) $ Intrinsic Value Using P/E Model (with growth in SPS factored in) \$\$ Current Price of Stock from Yahoo Finance:: Price of stock October 2 nd before the recent rally: $ Discussion: Do ary of these models seem to be far out of line? Do most of the models indicate under or over valuation relative to the current stock price? What about compared to the price on October 2nd before the recent rally in markets? and provides access ts its other service offerings. The Corepasy offers an assortment of merchandite and services at everytay low prices (FDU.P) The Conpany ocerates besugh theee segments. Waimat U.S. Vaimart letematich al and Sam's Club. The Waitart US. segment is a mertandisar of consumer producta, cperating undet toe Wainart and WVarmat Neighboitiood Macket srands, as well as wairaf cora and other segment incluses vaross formata divided into two categories: retail and whoiesain These categories contist of various formats, incluting supercertern, supstraivets typermarkets, warchouse clubs (ircluding Samis Cubt) and cash 8 carry, as weth as 6-commeice through walmat com mic, waimart ea, fipkart eom and other stes. The Sam's Club sogment a a memterabig-only marehouse club that aise operates saintelvibom. (2) Calculate the required rate of return for your company assuming a risk free rate of 3.8% and a market risk premium of 8% and the higher of the 2 beta estimates above using the CAPM formula (Rs=rf+B\MRP). (3) To construct a dividend discount model, you need an estimate of growth rate in the dividend. This model assumes that earnings and dividends grow at the same rate, which is obviously not true for most firms. Therefore, lets look at various sources of growth rates we might use for an estimate of future growth. (a) From the Value Line "Annual Rates" Section, record the annual Dividend Growth the last 10 years = (b) From the Value Line "Annual Rates" Section, record the annual Dividend Growth the last 5 years = (c) From the Value Line "Annual Rates" Section, analysts estimates of Dividend Gro (d) From the Value Line "Annual Rates" Section, analysts estimates of EPS Growth (e) From yahoo finance, analysts estimates of annual EPS Growth next 5 years (f) From the AAll sheet Est EPS Grth (\%)is analysts estimate of annual EPS Growth (g) g= ROE (1-DPR). ROE and the DPR (Al dividends to net profit) 2022 from Value Line (4) Calculate the expected return by adding the current dividend vield from Yahoo + the medion of the different growth measures you calculated or looked up in number 3 above(historic average, sustainable growth rate, Value line estimates, Yahoo, and AAll estimates). Expected Return =DividendYield+CapitalGainsYield(z)= How does the expected return in number 6 above compare with the required return in number 2? What does this tell you? (S) Use the lowest growth rate from number 3 above as the long run growth estimate and calculate what the stock is worth using the constant growth DD model (Gordon model). (6) As you probably noticed, the constant growth model only works for very mature firms. If the lowest growth rate of any of the estimates is still higher than the required rate, that one step constant growth model would give you a negative stock price which makes no sense. That is where analysts will use a multi stage growth model allowing for the fact that a company may have very good growth for the next few years before it slows down and approaches something more in line with the economy itself. Growth rate in the overall economy runs around 2.5 to 3.5% per year on average. You are going to use a four stage growth model to value your firm. Look at the analalysts estimates of growth in earnings of dividends (parts c,d,, and f in number 3 ) and select the highest growth rate of the four. \%. Now, assume that your company's carnings and dividends grow at that rate for the next five years before slowing down. When it does slow down, it will probably not just drop all in one year to whatever the general economy's growt rate is. It will slow over several years. We are going to assume that it slows over 2 years and then grows at a rate of 3.5K indefinitely inte the future. So, you have a beginning growth rate and an ending growth rate, now you need to pick two growth rates for years 6 and 7 that are between the high estimate and 3.5%. Year 6 growth rate should be higher than year 7 which should be higher than 3.5\%. Everyone will have a different growth rate, so the first thing you should do is show me the three growth rates that you plan to use in the blanks below. On the diagram above, using the required rate of return in number (2) above, and the dividend for 2022 on the value line sheet as Do, calculate the value of your stock if it grows more rapidly for the nect 5 years, then growth slows in years 6 and 7 , finally growing at around 3.5% indefinitely into the future. This is a multistage dividend discount model, Show your work an the diagram above. (7) Find the Book Value per Share for 2022 on the Value Line Surver. 5 . This is the Bo in the formulas for the residual income model (EVA). Assume the EPS for the firm erows at a constant rate of 3.5% forever and use the Earnings per share in the 2022 column of value line as your EPS, Compute the intrinic value of this stock using the Residual Income Model or EVA. (Show your work for credit.) (8) From the Value Une Investment Survey, find the following information for 2022 : 2022 Sales 2022 Operating Margin Compute the Operating Profit (EBIT) using the two items above: 2022 Depreciation $ Change in NWC from 2021 to 20225 Tax Rate Capital Spending Per Share $ Number of Shares Calculate the Operating Cash Flow for the Firm for 2022: Calculate the Free Cash Flow for the firm for 2022 (FCF d): The higher of the two betas from Value Line or AAll = The Debt to Equity from the " "Statistics" section of Yahoo a Use the equity beta to solve for the asset beta for the firm: B1=BA(1+[D/E(1T)]) Use the Ba that you calculated above and a risk free rate of 3.8% and market risk premium of Bx to estimate the required return for the firm (Rres). Using the required return for the firm that you calculated above, and assuming that the free cash flows are growing at a constant rate of 3.5% forever, calculate the value of the entire firm: V1=(RnmB)FCFn(1+g) Find the Book value of the firm's debt under "statistics" in Yahoos and the number of shares outstanding from Value Line and calculate the intrinsic value of this stock. (9) Using the AAll sheet, calculate the average P/E, P/B, P/CF, and P/S from the sheet for the last few years (omit negatives or outliers and omit the "current" column). Average P/E = Average P/B= Average P/S = Use the most recent EPS, BVPS, CFPS, and calculate the most recent SPS from the AMll sheet and use these to illustrate what the stock would typically sell for if it were trading at its average multiples. (frou will get four different values) Stock Value using P/E: $ Stock Value using P/B: 5 Stock Value using P/S: $ (10) None of the models above factor in growth in the accounting variable in the denominator. This is easy to do. Use the Value Line analysts expected growth rate in dividends from particl in number 3 above to calculate the expected dividend for the next five years. Estimate the EPS five years from now using the 2022 EPS Dil Cont from the AAll sheet and the Value line analysts expected growth rate in EPS. Apply the werage P/E for your stock to the year 5 EPS then discount back the five dividends and the year 5 price at the required rate that you calculated in number 2 on this sheet. This is the intrinsic value using the P/E model with earning and dividend growth factored (12) Repeat the process in number 11 to estimate the book value per share 5 years out uning the analysts estimate of growth in Book value %. Use the same dividends as you estimated in number 11, just re estimate the price in 5 years using Book Value Per share, then discount at the required rate. (13) Repeat the process in number 11&12 to estimate the Sales per share 5 years out using the analysts estimate of growth in Sales Per Share \%. Use the same dividends as you estimated in numbers 11&12, just re estimate the price in 5 years using Sales Per share, then discount at the required rate. SPS=$ You have computed the intrinsic value of this stock (what you think it should be selling for) using 9 different valuation models using estimates from several different analyst groups. Complete the graph of the P/E multiples as directed, upload it into blackboard and print out a copy of your graph and attach it to your exam. Record your results below along with the current stock price and discuss whether your stock appears to be overvalued or undervalued. Do any of these models seem to be far out of line? Do most of the models indicate under or over valuation relative to the current stock price? What about compared to the price on October 2 nd before the recent rally in markets? Intrinsic Value using Constant Growth DDM: $ Intrinsic Value using Variable Growth DDM: \$ Intrinsic Value using Residual income Model: \$\$ Intrinsic Value using Discounted Cash Flow Model: $ Intrinsic Value Using Price Multiple Models (no growth factored in) : P/E S P/B$ P/S$ Intrinsic Value Using P/E Model (with growth in EPS factored in) : $. Intrinsic Value Using P/BModel (with growth in BVPS factored in) $ Intrinsic Value Using P/E Model (with growth in SPS factored in) \$\$ Current Price of Stock from Yahoo Finance:: Price of stock October 2 nd before the recent rally: $ Discussion: Do ary of these models seem to be far out of line? Do most of the models indicate under or over valuation relative to the current stock price? What about compared to the price on October 2nd before the recent rally in markets 


Step by Step Solution
There are 3 Steps involved in it
Step: 1

Get Instant Access to Expert-Tailored Solutions
See step-by-step solutions with expert insights and AI powered tools for academic success
Step: 2

Step: 3

Ace Your Homework with AI
Get the answers you need in no time with our AI-driven, step-by-step assistance
Get Started


