Answered step by step
Verified Expert Solution
Question
1 Approved Answer
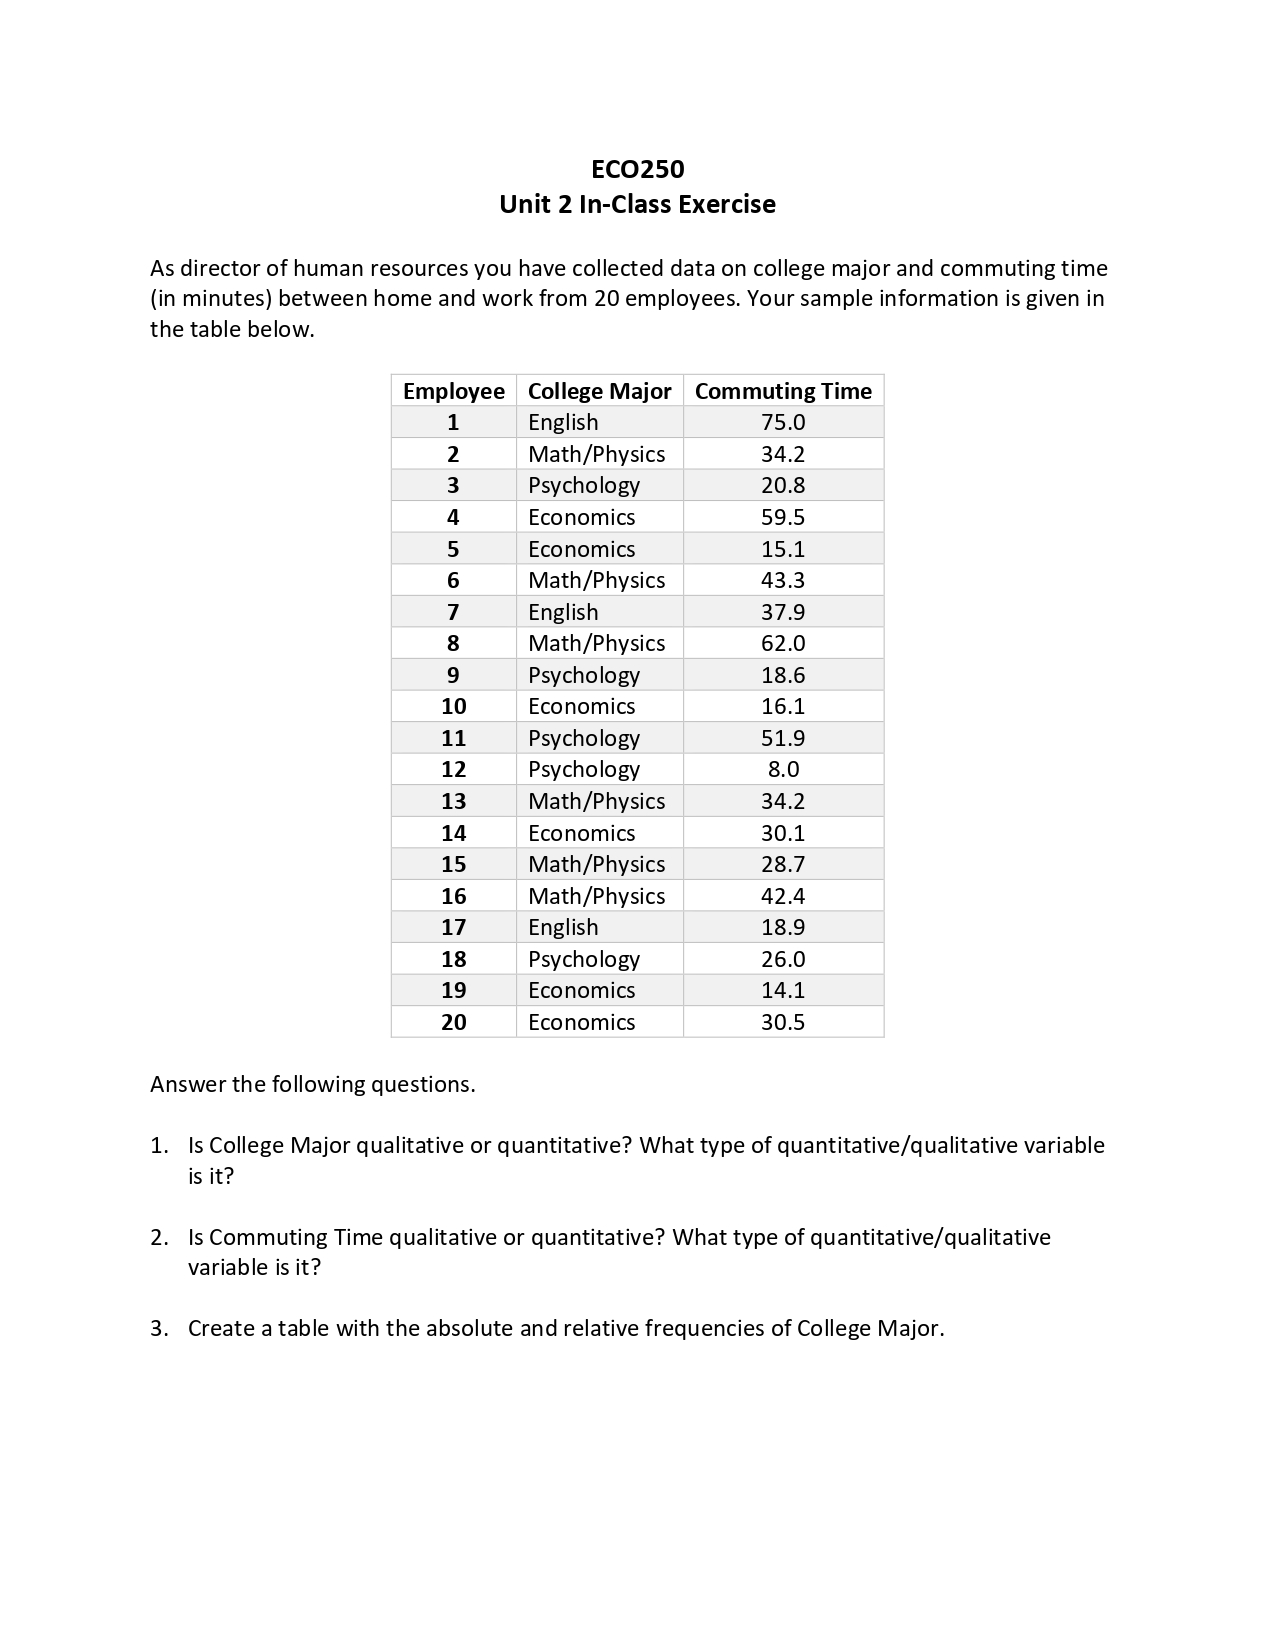
Answer the following questions.Employee College Major Commuting Time1 English 75.02 Math/Physics 34.23 Psychology 20.84 Economics 59.55 Economics 15.16 Math/Physics 43.37 English 37.98 Math/Physics 62.09 Psychology
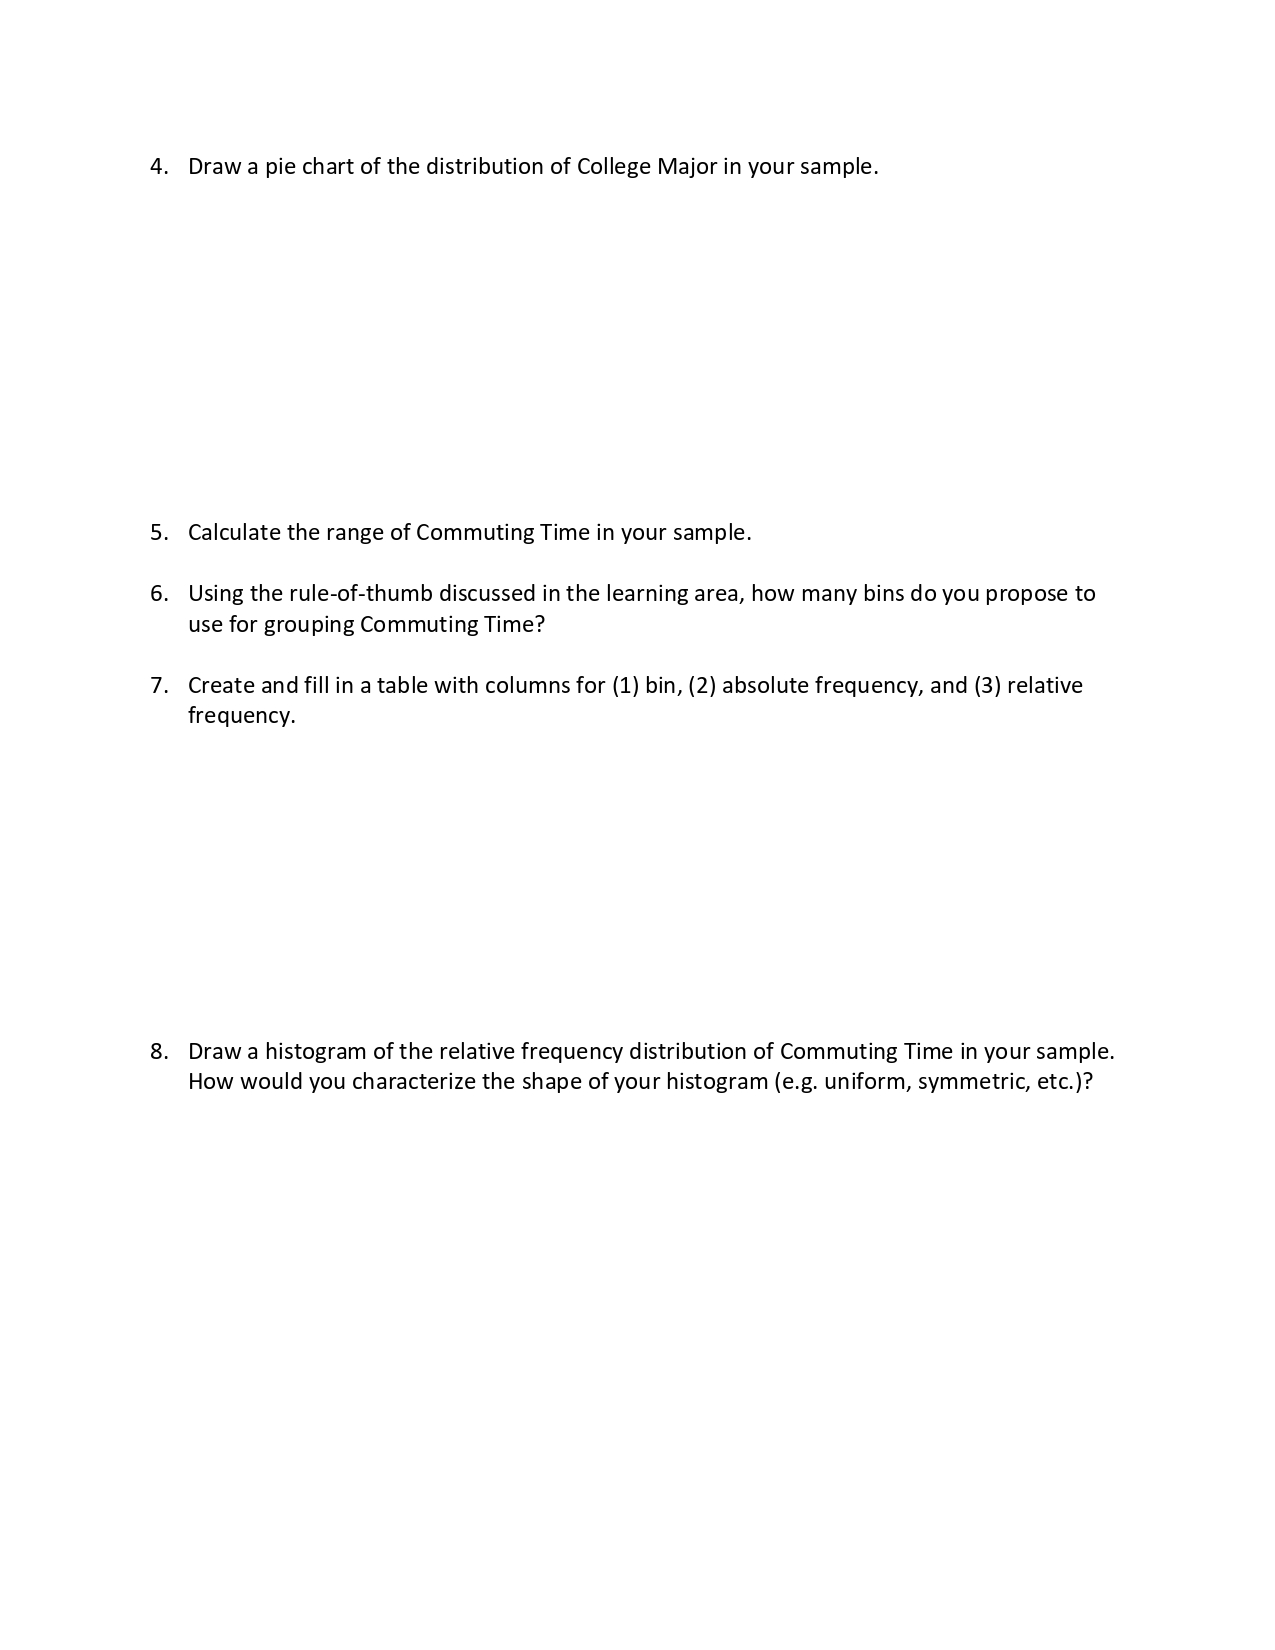
Answer the following questions.Employee College Major Commuting Time1 English 75.02 Math/Physics 34.23 Psychology 20.84 Economics 59.55 Economics 15.16 Math/Physics 43.37 English 37.98 Math/Physics 62.09 Psychology 18.610 Economics 16.111 Psychology 51.912 Psychology 8.013 Math/Physics 34.214 Economics 30.115 Math/Physics 28.716 Math/Physics 42.417 English 18.918 Psychology 26.019 Economics 14.120 Economics 30.51.Is College Major qualitative or quantitative? What type of quantitative/qualitative variable is it?2.Is Commuting Time qualitative or quantitative? What type of quantitative/qualitative variable is it?3.Create a table with the absolute and relative frequencies of College Major.4.Draw a pie chart of the distribution of College Major in your sample.5.Calculate the range of Commuting Time in your sample.6.Using the rule-of-thumb discussed in the learning area, how many bins do you propose to use for grouping Commuting Time?7.Create and fill in a table with columns for (1) bin, (2) absolute frequency, and (3) relative frequency.8.Draw a histogram of the relative frequency distribution of Commuting Time in your sample. How would you characterize the shape of your histogram (e.g. uniform, symmetric, etc.)? English 18.918 Psychology 26.019 Economics 14.120 Economics 30.5Answer the following questions.1.Is College Major qualitative or quantitative? What type of quantitative/qualitative variable is it?2.Is Commuting Time qualitative or quantitative? What type of quantitative/qualitative variable is it?3.Create a table with the absolute and relative frequencies of College Major.4.Draw a pie chart of the distribution of College Major in your sample.5.Calculate the range of Commuting Time in your sample.6.Using the rule-of-thumb discussed in the learning area, how many bins do you propose to use for grouping Commuting Time?7.Create and fill in a table with columns for (1) bin, (2) absolute frequency, and (3) relative frequency.8.Draw a histogram of the relative frequency distribution of Commuting Time in your sample. How would you characterize the shape of your histogram (e.g. uniform, symmetric, etc.)?


Step by Step Solution
There are 3 Steps involved in it
Step: 1

Get Instant Access to Expert-Tailored Solutions
See step-by-step solutions with expert insights and AI powered tools for academic success
Step: 2

Step: 3

Ace Your Homework with AI
Get the answers you need in no time with our AI-driven, step-by-step assistance
Get Started


