Answer the Question below please with Writing the Explanation and done by Microsoft Excel Pictures please
These are the Two companies Income Statement - Balance Sheet and CashFlow - Calculate all the needed Ratios from these statements - Using Dupont analysis - Please urgent

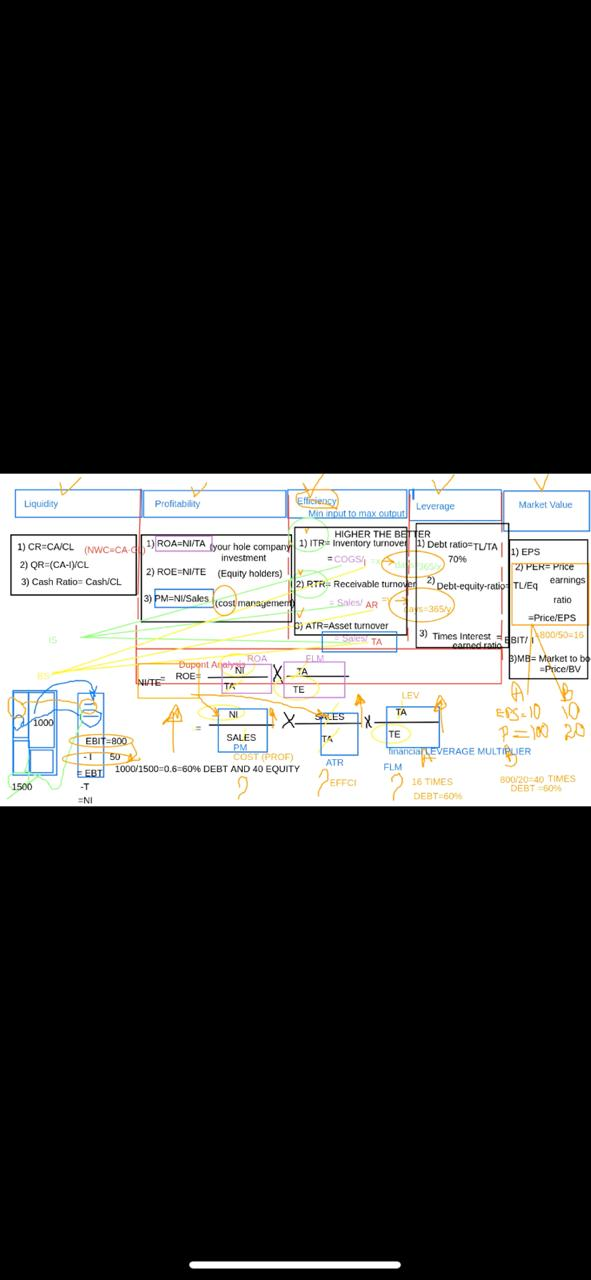
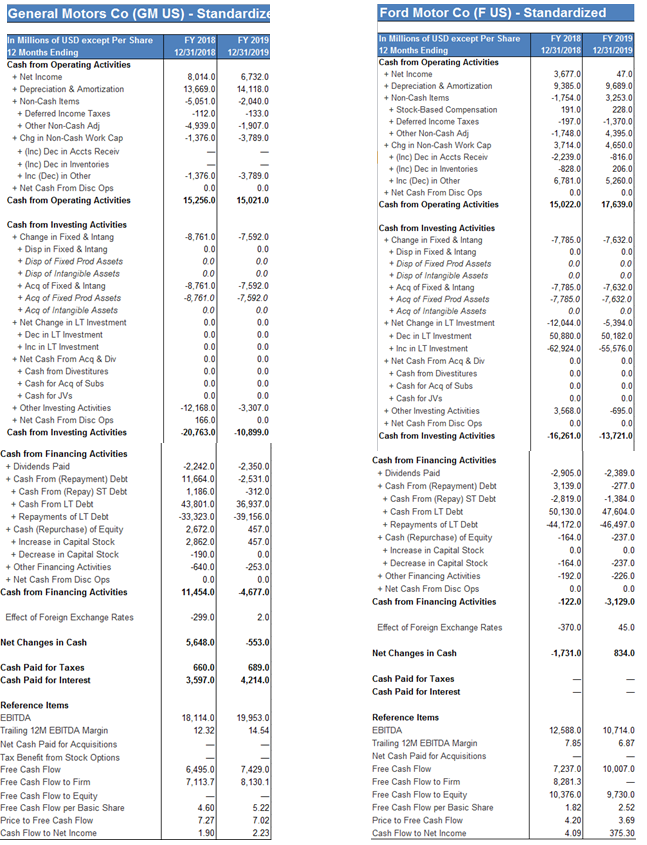
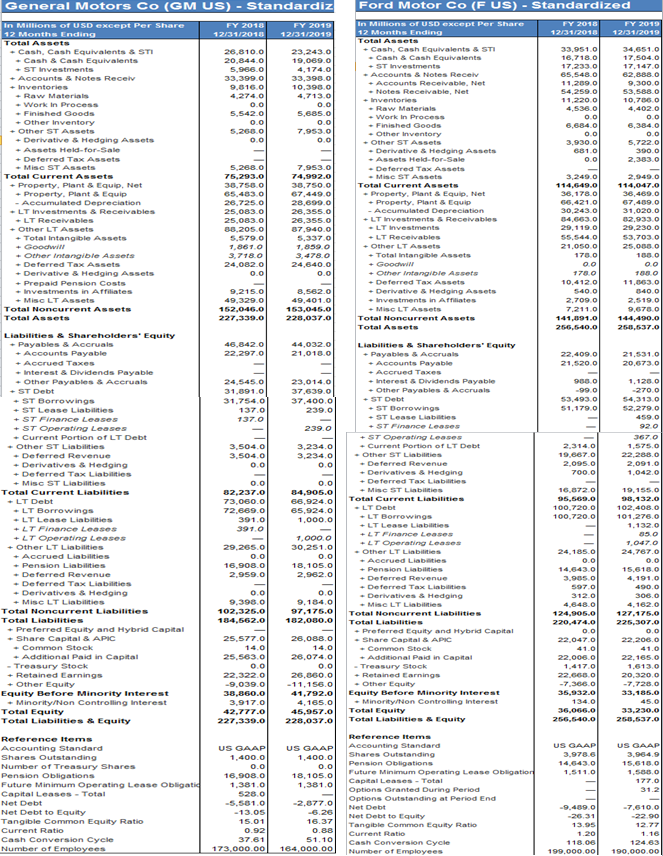
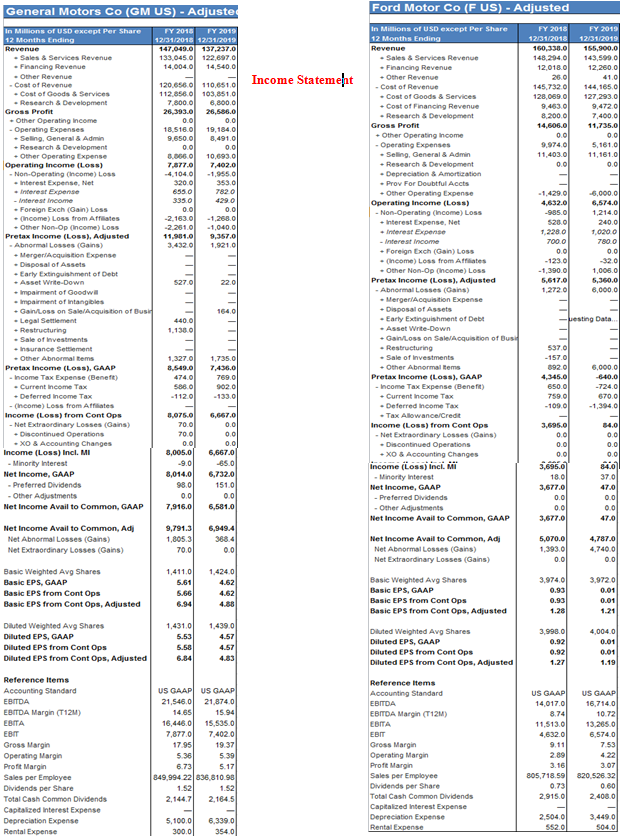
Calculate and interpret the two companies (Ford) and (GM) ratios (two years). Just the group of ratios mentioned in the grade center column. So you will upload your calculation and the interpretations, Best Regards, Liquidity Profitability Eficiency Market Value Min input to max cutout Leverage 3) PMENiSales cost management HIGHER THE BETTER 1) CRECACL (NWCCA DI ROA=NI/TA your hole company 1) ITR- Inventory turnove1) Debt ratio-TUTA 1) EPS investment 2) QR (CA-I/CL =COGS 70% 2) ROE=NI/TE (Equity holders) 2) PER= Price 3) Cash Ratio=CashCL 2) RTR Receivable turnover 2) Debl-equity-ratio TLE earnings Debt PMNSales ( Sales ARY ratio -365 il =Price/EPS 3) ATR=Asset turnover 3) Times Interest = BITI 800/50-16 samedrala ROA SIM BMB Market to be Dupont Analy -X ROE Price/BV XTA NITE TA TE LEV NI TA 1000 X EBS-10 10 SALES EBIT-800 TE TA P= 20 PM 50 COSTRO Titanic LEVERAGE MULTIPLER ATR E EBT 1000/1500-0.6-60% DEBT AND 40 EQUITY FLM 1500 -T EFFCI B002040 TIMES 16 TIMES DEBTO =NI DEBT-600 A XSRCES 2 2 Ford Motor Co (F US) - Standardized FY 2018 12/31/2018 FY 2019 12/31/2019 In Millions of USD except Per Share 12 Months Ending Cash from Operating Activities + Net Income + Depreciation & Amortization + Non-Cash Items + Stock-Based Compensation + Deferred Income Taxes + Other Non-Cash Adj + Chg in Non-Cash Work Cap + (Inc) Dec in Acets Receiv +(Inc) Dec in Inventories + Inc (Dec) in Other + Net Cash From Disc Ops Cash from Operating Activities 3,677.01 9,385.0 -1,754.0 191.0 -1970 -1.748.0 3.7140 -2.239.0 -828.00 6,781.0 0.01 15,022.01 47.0 9.689.0 3.253.0 228.0 -1.370 0 4,3950 4,6500 -8160 206.0 5.260.0 0.0 17,639.0 General Motors Co (GM US) - Standardize in Millions of USD except Per Share FY 2018 FY 2019 12 Months Ending 12/31/2018 12/31/2019 Cash from Operating Activities + Net Income 8,014.01 6.7320 + Depreciation & Amortization 13,669.0 14,118.0 + Non-Cash Items -5.051.01 -2,040.0 + Deferred Income Taxes -1120 -1330 + Other Non-Cash Adj 4,939.0 -1.907.0 + Chg in Non-Cash Work Cap -1,376.01 3.7890 + (Inc) Dec in Accts Receiv (Inc) Dec in Inventories + Inc (Dec) in Other -1,376.0 -3.789.0 + Net Cash From Disc Ops 0.0 0.0 Cash from Operating Activities 15,256.0 15,021.0 Cash from Investing Activities + Change in Fixed & Intang -8.761.00 -7.5920 + Disp in Fixed & Intang 0.0 0.0 + Disp of Fored Prod Assets 0.0 00 + Disp of Intangible Assets 0.0 0.0 + Acq of Fixed & Intang -8.761.0 -7.5920 + Acq of Fixed Prod Assets -8.761.0 -7,592.0 + Acq of Intangible Assets 0.0 0.0 + Net Change in LT Investment 0.0 + Dec in LT Investment 0.0 0.0 + Inc in LT Investment 0.0 + Net Cash From Acq & Div 0.0 + Cash from Divestitures 0.0 0.0 + Cash for Aca of Subs 0.01 0.0 +Cash for JVs 0.0 0.0 + Other Investing Activities -12.168.0 -3,307.0 + Net Cash From Disc Ops 1660 0.0 Cash from Investing Activities 20,763.0 -10,899.0 0.01 -7.785.0 0.0 0.0 0.0 -7.785.0 -7,7850 0.0 -12.044.0 50,880.0 -62.924.01 0.0 0.0 0.01 0.01 3,5680 0.0 .16.261.0 -7,632.0 0.0 0.0 00 -7,6320 -7,632.0 00 -5,394.0 50,182.0 -55,576.0 0.0 00 0.0 0 0 -695.0 00 -13,721.0 00 0.0 0 Cash from Financing Activities + Dividends Paid + Cash From (Repayment) Debt + Cash From (Repay) ST Debt + Cash From LT Debt +Repayments of LT Debt + Cash (Repurchase) of Equity + Increase in Capital Stock + Decrease in Capital Stock + Other Financing Activities + Net Cash From Disc Ops Cash from Financing Activities Effect of Foreign Exchange Rates Net Changes in Cash -2.242.0 11,664.0 1,186.01 43,801.0 -33,323.0 2,672.0 2,862.0 -1900 -6400 0.0 11,454.0 -2.350.0 -2.531.0 -312.01 36.9370 -39.156.0 457.0 457.0 0.01 -253.0 0.0 4,677.00 Cash from Investing Activities + Change in Fixed & Intang + Disp in Fixed & Intang + Disp of Fixed Prod Assets + Disp of Intangible Assets + Acq of Forced & Intang + Acq of Fixed Prod Assets + Acq of Intangible Assets + Net Change in LT Investment + Dec in LT Investment + Inc in LT Investment + Net Cash From Acq & Div + Cash from Divestitures + Cash for Ace of Subs + Cash for JVS + Other Investing Activities + Net Cash From Disc Ops Cash from Investing Activities Cash from Financing Activities + Dividends Paid + Cash From (Repayment) Debt + Cash From (Repay) ST Debt + Cash From LT Debt +Repayments of LT Debt + Cash (Repurchase) of Equity + Increase in Capital Stock + Decrease in Capital Stock + Other Financing Activities + Net Cash From Disc Ops Cash from Financing Activities Effect of Foreign Exchange Rates Net Changes in Cash Cash Pald for Taxes Cash Paid for Interest -2.905.0 3.139.00 -2.819.0 50.130.0 44,172.00 - 164.0 0.0 -1640 - 192.0 0.0 -122.0 2 389.0 -2770 -1,3840 47.604.0 -46.4970 -2370 00 -2370 -2260 0.0 3,129.0 -299.00 2.0 -3700 45.0 5,648.0 553.0 -1,731.0 834.0 Cash Paid for Taxes Cash Paid for Interest 660.0 3,597.0 689.0 4,214.0 18,114.0 12.32 19.953.01 14.54 12,588.0 7.85 10.7140 6.87 Reference Items EBITDA Trailing 12M EBITDA Margin Net Cash Paid for Acquisitions Tax Benefit from Stock Options Free Cash Flow Free Cash Flow to Firm Free Cash Flow to Equity Free Cash Flow per Basic Share Price to Free Cash Flow Cash Flow to Net Income 10.0070 6.495.0 7.113.7 7.429.0 8.130.1 Reference Items EBITDA Trailing 12M EBITDA Margin Net Cash Paid for Acquisitions Free Cash Flow Free Cash Flow to Firm Free Cash Flow to Equity Free Cash Flow per Basic Share Price to Free Cash Flow Cash Flow to Net Income 7,2370 8,281.3 10,376.0 1.82 4.20 4.09 4.60 727 1.90 5.22 7.02 2.23 9.730.0 2.52 3.69 375.30 Ford Motor CO (F US) - Standardized In Millions of USD except Per Share FY 2015 FY 2019 12 Months Ending 12/31/2018 12/31/2019 Total Assets - Cash Cash Equivalents & STI 33,951.0 34,651.0 - Cash & Cash Equivalents 16,718.0 17,504.0 ST Investments 17.233.0 17.147.01 Accounts & Notes Rece 85,548.0 62,888.0 + Accounts Receivable, Net 11.269.0 9.300.0 - Notes Receivable, Net 54,259.0 53,588 0 Inventories 11.220.0 10.706.0 - Raw Materiais 4,536.0 4,402.0 Work In Process 00 00 Finished Goods 6,6840 6,384.0 - Other Inventory 00 0.0 Other ST Assets 3,930.0 5,7220 - Derivative & Hedging Assets 6810 390.0 Assets Held-For Sale 0.0 2,383 0 - Deferred Tax Assets - Misc ST Assets 3,240.0 2,9490 Total Current Assets 114,649.0 114,047.0 - Property. Plant & Equip, Net 38,178.0 36,4690 Property. Plant & Equip 66.421.0 67,439.0 - Accumulated Depreciation 30,243.0 31,020.01 - LT Investments & Receivables 54.663.0 62,933.01 -LT Investments 29,119.0 29,230.0 -LT Receivables 55.544.0 53,7030 + Other LT Assets 21.050.0 25.000 - Total Intangible Assets 1780 1 O + Goodwin OO 00 + Other Intangible Assets 1700 TO Deferred Tax Assets 10,4120 11.063.0 Derivative & Hedging Assets 540.0 340.0 Investments in Affiliates 2.709.0 2,519.0 - Misc LT Assets 7.211.0 9.6700 Total Noncurrent Assets 141,091.0 144,490.0 Total Assets 256,640.0 256,637.0 22.409.0 21.520.0 21,5310 20.673.0 900.0 -990 53,493.0 51.170.0 General Motors Co (GM US) - Standardiz in Millions of USD except Per Share FY 2018 FY 2019 12 Months Ending 12/31/2013 12/31/2019 Total Assets Cash Cash Equivalents & STI 26.810.0 23,243.0 - Cash & Cash Equivalents 20.844.0 19,069.0 ST Investments 5.966.0 4,174.0 - Accounts & Notes Receiv 33,399.0 33,398.0 Inventories 9.616.0 10.396.0 Raw Materials 4.274.0 4,7130 - Work in Process 0.0 00 Finished Goods 5,542.0 5,685.0 + Other Inventory 0.0 0.0 Other ST Assets 5.263.0 7.953.0 - Derivative & Hedging Assets 0.0 0.0 - Assets Heid-for-Sale +Deferred Tax Assets - Misc ST Assets 5,268.0 7,953.0 Total Current Assets 75,293.0 74,992.0 Property. Plant & Equip, Net 30.750.0 38,750.0 - Property. Plant & Equip 65.483.0 67.449.0 - Accumulated Depreciation 26.725.0 28,699.0 +LT Investments & Receivables 25.083.0 26,355.0 LT Receivables 25.083.0 26,355.0 + Other LT Assets 38,205.0 87.940.0 Total Intangible Assets 5.579.0 5.337.0 + Goodwill 1.061.0 + Other Intangible Assets 3.718.0 3,478.0 -Deferred Tax Assets 24.082.0 24,640.0 + Derivative & Hedging Assets 0.0 0.0 + Prepaid Pension Costs - Investments in Affiliates 9.215.0 8,562.0 Miso LT Assets 49,3290 49.401.0 Total Noncurrent Assets 152.046.0 153,045.0 Total Assets 227,339.0 228.037.0 Liabilities & Shareholders' Equity Payables & Accruals 46,842.0 4.4.032.0 + Accounts Payable 22,297.0 21.010.0 + Accrued Taxes - Interest & Dividends Payable - Other Payables & Accruals 24.545.0 23.014.0 - ST Debt 31.891.0 37.639.0 +ST Borrowings 31.754.0 37.400.0 ST Lease Liabilities 137.0 239.0 + ST Finance LOGOS 137.0 +ST Operating Leases 239.0 - Current Portion of LT Debt Other ST Liabilities 3.504.0 3.234.0 -Deferred Revenue 3.504.0 3,234.0 Derivatives & Hedging 0.0 0.0 - Deferred Tax Liabilities - Misc ST Liabilities 0.0 0.0 Total Current Liabilities 82,237.0 84,905.0 -LT Debt 73.060.0 66,924.0 -LT Borrowings 72.669.0 65.924.0 - LT Lease Liabilities 3910 1.000.0 +LT Finance Losses 3910 +LT Operating Lesses 1.000.0 + Other LT Liabilities 29.265.0 30,251.0 + Accrued Liabilities 0.0 0.0 - Pension Liabilities 16.908.0 18,105.0 -Deferred Revenue 2.959.0 2,962.0 Deferred Tax Liabilities - Derivatives & Hedging 0.0 0.0 - Misc LT Liabilities 9.398.0 9.184.0 Total Noncurrent Liabilities 102,325.0 97.175.0 Total Liabilities 184,562.0 182,080.0 Preferred Equity and Hybrid Capital - Share Capital & APIC 25.577.00 26.088.0 Common Stock 14.0 14.0 - Additional Paid in Capital 25.563.0 26.074.0 - Treasury Stock 0.0 0.0 + Retained Earnings 22.322.0 26,860.0 + Other Equity -9.039.0 - 11.156.0 Equity Before Minority interest 38,860.0 41,792.0 Minority/Non Controlling interest 3.917.0 4,165.0 Total Equity 42.777.0 45,957.0 Total Liabilities & Equity 227.339.0 228,037.0 Reference Items Accounting Standard US GAAP US GAAP Shares Outstanding 1.400.0 1.400.0 Number of Treasury Shares 0.0 0.0 Pension Obligations 16,908.0 18,105.0 Future Minimum Operating Lease Obligatid 1.3810 1.381.0 Capital Leases - Total 528.0 Net Debt -5.581.0 -2.877.0 Net Debt to Equity - 13.05 -6.26 Tangible Common Equity Ratio 15.01 16.37 Current Ratio 0.92 0.88 Cash Conversion Cycle 37.61 51.10 Number of employees 173 000.00 184,000.00 1,120.0 270.0 54.313.0 52,279.0 459.0 920 367.0 1.575.0 22,288.0 2,091.0 1.042.0 2.314.01 19.067.0 2.095.0 700.0 16,8720 95,569.0 100.720.0 100.720.0 Liabilities & Shareholders' Equity Payables & Accruals Accounts Payable Accrued Taxes Interest & Dividends Payable Other Payables & Accruals - ST Debt + ST Borrowings +ST Lease Liabilities + ST Finance Leases + ST Operating Lesses - Current Portion of LT Debt - Other ST Liabilities - Deferred Revenue Derivatives & Hedging + Deferred Tax Liabilities - Misc ST Liabilities Total Current Liabilities -LT Debt LT Borrowings - LT Lease Liebes +LT Finance Less +LT Operating Leases - Other LT Liabilities - Accrued Liabilities Pension Liabilities + Deferred Revenue - Deferred Tax Liabilities - Derivatives & Hedging - Misc LT Liabilities Total Noncurrent Liabilities Total Liabilities Preferred Equity and Hybrid Capital Share Capital & APIC - Common Stock - Additional Paid in Capital - Treasury Stock Retained Earnings - Other Equity Equity Before Minority Interest - Minority/Non Controlling Interest Total Equity Total Liabilities & Equity 24.135.0 0.0 14.643.0 3.985.0 5970 312.0 4.648.0 124,905.0 220,474.0 0.0 22.047.0 19,155.0 98,132.0 102,400.0 101,276.0 1.132.0 SO 1,047.0 24,767.0 0.0 15.6180 4.191.0 490.0 306.0 4.162.0 127.175.0 225.307.0 0.0 22.206.0 41.0 22,165.0 1.613.0 20,320.0 -7.728.0 33,185.0 45.0 33.230.0 266.537.0 22.006.0 1.417.0 22.663 O -7.366. 35,932.0 134.0 36,066.0 256,540.0 US GAAP 3.978.6 14,643.0 1.511.0 US GAAP 3.964.9 15.610.0 1.585.0 177.0 31.2 Reference Items Accounting Standard Shares Outstanding Pension Obligations Future Minimum Operating Lease Obligation Capital Leases - Total Options Granted During Period Options Outstanding at Period End Net Debt Net Debt to Equity Tangible Common Equity Ratio Current Ratio Cash Conversion Cycle Number of employees 13.95 -7.610.0 22.90 12.77 1.16 124.63 190.000.00 118.06 199,000.00 Income Statement General Motors Co (GM US) - Adjusted In Millions of USD except Per Share FY 2018 FY 2015 12 Months Ending 12/31/2018 12/31/2019 Revenue 147.049.0 137,237.0 - Sales & Services Revenue 133.045.0 122,6970 - Financing Revenue 14.004.0 14,540.0 - Other Revenue - Cost of Revenue 120.656.0 110.651.0 - Cost of Goods & Services 112.8560 103,851.0 - Research & Development 7.800 6,800.0 Gross Profit 26,393.0 26,586.0 Other Operating income 0.0 0.0 - Operating Expenses 18.516.0 19,184.0 - Seling. General & Admin 9.650.0 8,491.0 Research & Development 0.0 Other Operating Expense 8.066.0 10.693.0 Operating Income (Loss) 7,877.0 7.402.0 - Non-Operating (income) Loss -4.1040 - 1,955.0 - Interest Expense, Net 3200 353.0 Interest Expense 655.0 7820 - Interest income 335.0 429.0 - Foreign Exch (Gain) Loss 0.0 0.0 -Income) Loss from Artes -2.163.0 -1,268.0 + Other Non-Op Income) Loss -2.2010 -1,040.0 Pretax Income (Loss), Adjusted 11.981.0 9,357.0 - Abnormal Loss (Gains) 3.4320 1.921.0 Merger Acquisition Expense - Disposal of Assets Earty Extinguishment of Debt Asset Write-Down 5270 220 Impairment of Goodwill - Impairment of intangibles +Gain/Loss on Sale Acquisition of Busi 1640 - Legal Settlement 440.0 Restructuring 1.138.0 - Sale of investments Insurance Settlement - Other Abnormal tems 1,327,0 1.735.0 Pretax Income (Loss), GAAP 8.549.0 7.436.0 - Income Tax Expense (Beneft) 4740 769.0 Current Income Tax 902.0 Deferred Income Tax -1120 - 133.0 - (income) Loss from Affiliates Income (Loss) from Cont Ops 8.075.0 6,667.0 - Net Extraordinary Losses (Gains) 70.0 0.0 Discontinued Operations 700 - XO & Accounting Changes 0.0 0.0 Income (Loss) Incl. Mi 8,005.0 6,667.0 - Minority interest -9.0 -65.0 Net Income, GAAP 8,014.0 6,732.0 - Preferred Dividends 98.0 151.0 - Other Adjustments 0.0 0.0 Net Income Avail to Common, GAAP 7,916.01 6,581.0 Ford Motor Co (F US) - Adjusted in Millions of USD except Per Share FY 2018 FY 2019 12 Months Ending 12/31/2018 12/31/2019 Revenue 160.338.0 155,900.0 - Sales & Services Revenue 148.294.00 143,599.0 - Financing Revenue 12.018.0 12,260.0 Other Revenue 26.0 41.0 - Cost of Revenue 145,7320 144, 165.0 Cost of Goods & Services 128,069.0 127,293.0 - Cost of Financing Revenue 9,472.0 - Research & Development 8.2000 7,400.0 Gross Profit 14,606.0 11,735.0 + Other Operating income 0.0 0.0 - Operating Expenses 9.974.0 5,161,0 - Seling, General & Admin 11,403.0 11.161.0 + Research & Development 0.0 0.0 - Depreciation & Amortization -Prov For Doubtful Accts + Other Operating Expense -1,429.0 -5,000.0 Operating Income (Loss) 4,632.0 6,574.0 - Non-Operating (Income) Loss -9850 1,214,0 + Interest Expense, Net 520.0 240.0 Interest Expense 1.2280 1.0200 - Interest income 700.0 7800 +Foreign Exch (Gain) Loss 0.0 0.0 - (Income) Loss from Affiliates -1230 Other Non-Op Income) Loss - 1,390.0 1,005.0 Pretax Income (Loss), Adjusted 6,617,0 6.360.0 - Abnormal Losses (Gains) 1.272.0 6,000.0 Merger Acquisition Expense Disposal of Assets Early Extinguishment of Debt -esting Data - Asset Write-Down + Gain/Loss on Sale Acquisition of - Restructuring 5370 - Sale of investments -157.0 Other Abnormal tems 8920 6,000.0 Pretax Income (Loss), GAAP 4,345.0 -6-40.0 - Income Tax Expense (Benefit) 650.0 -724.0 + Current Income Tax 759.0 670.0 - Deferred income Tax -1090 -1,394,0 - Tax Allowance/Credit Income (Loss) from Cont Ops 3.695.0 84.0 - Net Extraordinary Losses (Gains) 00 0.0 - Discontinued Operations 0.0 0.0 - XO & Accounting Changes 0.01 00 income (Loss) incl. Mi 3,695.0 34.0 - Minority interest 18.0 370 Net Income, GAAP 3,677.0 47.0 - Preferred Dividends 0.0 0.0 - Other Adjustments 0.01 Net Income Avail to Common, GAAP 3,677.0 47.0 5880 6,949.4 Net Income Avail to Common, Adj Net Abnormal Losses (Gains) Net Extraordinary Losses (Gains) 9,791.3 1,805.31 70.0 0.0 Net Income Avail to Common, Adj Net Abnormal Losses (Gains) Net Extraordinary Losses (Gains) 5,070.0 1,393.0 0.0 4,787.0 4,740.0 00 Basic Weighted Avg Shares Basic EPS, GAAP Basic EPS from Cont Ops Basic EPS from Cont Ops, Adjusted 1,411.0 5.61 5.66 6.94 1,424.0 4.62 4.62 Basic Weighted Avg Shares Basic EPS, GAAP Basic EPS from Cont Ops Basic EPS from Cont Ops, Adjusted 3.974,0 0.93 0.93 1.28 3.9720 0.01 0.01 Diluted Weighted Avg Shares Diluted EPS, GAAP Diluted EPS from Cont Ops Diluted EPS from Cont Ops, Adjusted 1,4310 5.53 5.58 1.439.0 4.57 4.57 3,998.0 0.92 0.92 1.27 4,0040 0.01 0.01 1.19 Reference Items Accounting Standard EBITDA EBITDA Margin (T12M) EBITA EBIT Gross Margin Operating Margin Profit Margin Sales per Employee Dividends per Share Total Cash Common Dividends Captalized interest Expense Depreciation Expense Rental Expense US GAAP US GAAP 21,546,0 21,874.0 14.65 15.94 16,446.0 15,535.0 7,877.0 7.402.0 17.95 19.37 5.36 5.39 6.73 5.17 849,99422 336,810.98 1.52 1.52 2,144.7 2.164.5 Diluted Weighted Avg Shares Diluted EPS, GAAP Diluted EPS from Cont Ops Diluted EPS from Cont Ops, Adjusted Reference Items Accounting Standard EBITDA EBITDA. Margin (T12M) EBITA EBIT Gross Margin Operating Margin Proft Margin Sales per Employee Dividends per Share Total Cash Common Dividends Capitalized interest Expense Depreciation Expense Rental Expense US GAAP 14,017.0 8.74 11,513.0 4,6320 9.11 2.89 3.16 805,718.50 0.73 2.915.0 US GAAP 16.714.0 10.72 13.265.0 6.574.0 7.53 4.22 3.07 820.526 32 0.60 2,408.0 5,100.0 300.0 6,339.0 354.0 2.504.0 552.0 3,449.0 5040 Calculate and interpret the two companies (Ford) and (GM) ratios (two years). Just the group of ratios mentioned in the grade center column. So you will upload your calculation and the interpretations, Best Regards, Liquidity Profitability Eficiency Market Value Min input to max cutout Leverage 3) PMENiSales cost management HIGHER THE BETTER 1) CRECACL (NWCCA DI ROA=NI/TA your hole company 1) ITR- Inventory turnove1) Debt ratio-TUTA 1) EPS investment 2) QR (CA-I/CL =COGS 70% 2) ROE=NI/TE (Equity holders) 2) PER= Price 3) Cash Ratio=CashCL 2) RTR Receivable turnover 2) Debl-equity-ratio TLE earnings Debt PMNSales ( Sales ARY ratio -365 il =Price/EPS 3) ATR=Asset turnover 3) Times Interest = BITI 800/50-16 samedrala ROA SIM BMB Market to be Dupont Analy -X ROE Price/BV XTA NITE TA TE LEV NI TA 1000 X EBS-10 10 SALES EBIT-800 TE TA P= 20 PM 50 COSTRO Titanic LEVERAGE MULTIPLER ATR E EBT 1000/1500-0.6-60% DEBT AND 40 EQUITY FLM 1500 -T EFFCI B002040 TIMES 16 TIMES DEBTO =NI DEBT-600 A XSRCES 2 2 Ford Motor Co (F US) - Standardized FY 2018 12/31/2018 FY 2019 12/31/2019 In Millions of USD except Per Share 12 Months Ending Cash from Operating Activities + Net Income + Depreciation & Amortization + Non-Cash Items + Stock-Based Compensation + Deferred Income Taxes + Other Non-Cash Adj + Chg in Non-Cash Work Cap + (Inc) Dec in Acets Receiv +(Inc) Dec in Inventories + Inc (Dec) in Other + Net Cash From Disc Ops Cash from Operating Activities 3,677.01 9,385.0 -1,754.0 191.0 -1970 -1.748.0 3.7140 -2.239.0 -828.00 6,781.0 0.01 15,022.01 47.0 9.689.0 3.253.0 228.0 -1.370 0 4,3950 4,6500 -8160 206.0 5.260.0 0.0 17,639.0 General Motors Co (GM US) - Standardize in Millions of USD except Per Share FY 2018 FY 2019 12 Months Ending 12/31/2018 12/31/2019 Cash from Operating Activities + Net Income 8,014.01 6.7320 + Depreciation & Amortization 13,669.0 14,118.0 + Non-Cash Items -5.051.01 -2,040.0 + Deferred Income Taxes -1120 -1330 + Other Non-Cash Adj 4,939.0 -1.907.0 + Chg in Non-Cash Work Cap -1,376.01 3.7890 + (Inc) Dec in Accts Receiv (Inc) Dec in Inventories + Inc (Dec) in Other -1,376.0 -3.789.0 + Net Cash From Disc Ops 0.0 0.0 Cash from Operating Activities 15,256.0 15,021.0 Cash from Investing Activities + Change in Fixed & Intang -8.761.00 -7.5920 + Disp in Fixed & Intang 0.0 0.0 + Disp of Fored Prod Assets 0.0 00 + Disp of Intangible Assets 0.0 0.0 + Acq of Fixed & Intang -8.761.0 -7.5920 + Acq of Fixed Prod Assets -8.761.0 -7,592.0 + Acq of Intangible Assets 0.0 0.0 + Net Change in LT Investment 0.0 + Dec in LT Investment 0.0 0.0 + Inc in LT Investment 0.0 + Net Cash From Acq & Div 0.0 + Cash from Divestitures 0.0 0.0 + Cash for Aca of Subs 0.01 0.0 +Cash for JVs 0.0 0.0 + Other Investing Activities -12.168.0 -3,307.0 + Net Cash From Disc Ops 1660 0.0 Cash from Investing Activities 20,763.0 -10,899.0 0.01 -7.785.0 0.0 0.0 0.0 -7.785.0 -7,7850 0.0 -12.044.0 50,880.0 -62.924.01 0.0 0.0 0.01 0.01 3,5680 0.0 .16.261.0 -7,632.0 0.0 0.0 00 -7,6320 -7,632.0 00 -5,394.0 50,182.0 -55,576.0 0.0 00 0.0 0 0 -695.0 00 -13,721.0 00 0.0 0 Cash from Financing Activities + Dividends Paid + Cash From (Repayment) Debt + Cash From (Repay) ST Debt + Cash From LT Debt +Repayments of LT Debt + Cash (Repurchase) of Equity + Increase in Capital Stock + Decrease in Capital Stock + Other Financing Activities + Net Cash From Disc Ops Cash from Financing Activities Effect of Foreign Exchange Rates Net Changes in Cash -2.242.0 11,664.0 1,186.01 43,801.0 -33,323.0 2,672.0 2,862.0 -1900 -6400 0.0 11,454.0 -2.350.0 -2.531.0 -312.01 36.9370 -39.156.0 457.0 457.0 0.01 -253.0 0.0 4,677.00 Cash from Investing Activities + Change in Fixed & Intang + Disp in Fixed & Intang + Disp of Fixed Prod Assets + Disp of Intangible Assets + Acq of Forced & Intang + Acq of Fixed Prod Assets + Acq of Intangible Assets + Net Change in LT Investment + Dec in LT Investment + Inc in LT Investment + Net Cash From Acq & Div + Cash from Divestitures + Cash for Ace of Subs + Cash for JVS + Other Investing Activities + Net Cash From Disc Ops Cash from Investing Activities Cash from Financing Activities + Dividends Paid + Cash From (Repayment) Debt + Cash From (Repay) ST Debt + Cash From LT Debt +Repayments of LT Debt + Cash (Repurchase) of Equity + Increase in Capital Stock + Decrease in Capital Stock + Other Financing Activities + Net Cash From Disc Ops Cash from Financing Activities Effect of Foreign Exchange Rates Net Changes in Cash Cash Pald for Taxes Cash Paid for Interest -2.905.0 3.139.00 -2.819.0 50.130.0 44,172.00 - 164.0 0.0 -1640 - 192.0 0.0 -122.0 2 389.0 -2770 -1,3840 47.604.0 -46.4970 -2370 00 -2370 -2260 0.0 3,129.0 -299.00 2.0 -3700 45.0 5,648.0 553.0 -1,731.0 834.0 Cash Paid for Taxes Cash Paid for Interest 660.0 3,597.0 689.0 4,214.0 18,114.0 12.32 19.953.01 14.54 12,588.0 7.85 10.7140 6.87 Reference Items EBITDA Trailing 12M EBITDA Margin Net Cash Paid for Acquisitions Tax Benefit from Stock Options Free Cash Flow Free Cash Flow to Firm Free Cash Flow to Equity Free Cash Flow per Basic Share Price to Free Cash Flow Cash Flow to Net Income 10.0070 6.495.0 7.113.7 7.429.0 8.130.1 Reference Items EBITDA Trailing 12M EBITDA Margin Net Cash Paid for Acquisitions Free Cash Flow Free Cash Flow to Firm Free Cash Flow to Equity Free Cash Flow per Basic Share Price to Free Cash Flow Cash Flow to Net Income 7,2370 8,281.3 10,376.0 1.82 4.20 4.09 4.60 727 1.90 5.22 7.02 2.23 9.730.0 2.52 3.69 375.30 Ford Motor CO (F US) - Standardized In Millions of USD except Per Share FY 2015 FY 2019 12 Months Ending 12/31/2018 12/31/2019 Total Assets - Cash Cash Equivalents & STI 33,951.0 34,651.0 - Cash & Cash Equivalents 16,718.0 17,504.0 ST Investments 17.233.0 17.147.01 Accounts & Notes Rece 85,548.0 62,888.0 + Accounts Receivable, Net 11.269.0 9.300.0 - Notes Receivable, Net 54,259.0 53,588 0 Inventories 11.220.0 10.706.0 - Raw Materiais 4,536.0 4,402.0 Work In Process 00 00 Finished Goods 6,6840 6,384.0 - Other Inventory 00 0.0 Other ST Assets 3,930.0 5,7220 - Derivative & Hedging Assets 6810 390.0 Assets Held-For Sale 0.0 2,383 0 - Deferred Tax Assets - Misc ST Assets 3,240.0 2,9490 Total Current Assets 114,649.0 114,047.0 - Property. Plant & Equip, Net 38,178.0 36,4690 Property. Plant & Equip 66.421.0 67,439.0 - Accumulated Depreciation 30,243.0 31,020.01 - LT Investments & Receivables 54.663.0 62,933.01 -LT Investments 29,119.0 29,230.0 -LT Receivables 55.544.0 53,7030 + Other LT Assets 21.050.0 25.000 - Total Intangible Assets 1780 1 O + Goodwin OO 00 + Other Intangible Assets 1700 TO Deferred Tax Assets 10,4120 11.063.0 Derivative & Hedging Assets 540.0 340.0 Investments in Affiliates 2.709.0 2,519.0 - Misc LT Assets 7.211.0 9.6700 Total Noncurrent Assets 141,091.0 144,490.0 Total Assets 256,640.0 256,637.0 22.409.0 21.520.0 21,5310 20.673.0 900.0 -990 53,493.0 51.170.0 General Motors Co (GM US) - Standardiz in Millions of USD except Per Share FY 2018 FY 2019 12 Months Ending 12/31/2013 12/31/2019 Total Assets Cash Cash Equivalents & STI 26.810.0 23,243.0 - Cash & Cash Equivalents 20.844.0 19,069.0 ST Investments 5.966.0 4,174.0 - Accounts & Notes Receiv 33,399.0 33,398.0 Inventories 9.616.0 10.396.0 Raw Materials 4.274.0 4,7130 - Work in Process 0.0 00 Finished Goods 5,542.0 5,685.0 + Other Inventory 0.0 0.0 Other ST Assets 5.263.0 7.953.0 - Derivative & Hedging Assets 0.0 0.0 - Assets Heid-for-Sale +Deferred Tax Assets - Misc ST Assets 5,268.0 7,953.0 Total Current Assets 75,293.0 74,992.0 Property. Plant & Equip, Net 30.750.0 38,750.0 - Property. Plant & Equip 65.483.0 67.449.0 - Accumulated Depreciation 26.725.0 28,699.0 +LT Investments & Receivables 25.083.0 26,355.0 LT Receivables 25.083.0 26,355.0 + Other LT Assets 38,205.0 87.940.0 Total Intangible Assets 5.579.0 5.337.0 + Goodwill 1.061.0 + Other Intangible Assets 3.718.0 3,478.0 -Deferred Tax Assets 24.082.0 24,640.0 + Derivative & Hedging Assets 0.0 0.0 + Prepaid Pension Costs - Investments in Affiliates 9.215.0 8,562.0 Miso LT Assets 49,3290 49.401.0 Total Noncurrent Assets 152.046.0 153,045.0 Total Assets 227,339.0 228.037.0 Liabilities & Shareholders' Equity Payables & Accruals 46,842.0 4.4.032.0 + Accounts Payable 22,297.0 21.010.0 + Accrued Taxes - Interest & Dividends Payable - Other Payables & Accruals 24.545.0 23.014.0 - ST Debt 31.891.0 37.639.0 +ST Borrowings 31.754.0 37.400.0 ST Lease Liabilities 137.0 239.0 + ST Finance LOGOS 137.0 +ST Operating Leases 239.0 - Current Portion of LT Debt Other ST Liabilities 3.504.0 3.234.0 -Deferred Revenue 3.504.0 3,234.0 Derivatives & Hedging 0.0 0.0 - Deferred Tax Liabilities - Misc ST Liabilities 0.0 0.0 Total Current Liabilities 82,237.0 84,905.0 -LT Debt 73.060.0 66,924.0 -LT Borrowings 72.669.0 65.924.0 - LT Lease Liabilities 3910 1.000.0 +LT Finance Losses 3910 +LT Operating Lesses 1.000.0 + Other LT Liabilities 29.265.0 30,251.0 + Accrued Liabilities 0.0 0.0 - Pension Liabilities 16.908.0 18,105.0 -Deferred Revenue 2.959.0 2,962.0 Deferred Tax Liabilities - Derivatives & Hedging 0.0 0.0 - Misc LT Liabilities 9.398.0 9.184.0 Total Noncurrent Liabilities 102,325.0 97.175.0 Total Liabilities 184,562.0 182,080.0 Preferred Equity and Hybrid Capital - Share Capital & APIC 25.577.00 26.088.0 Common Stock 14.0 14.0 - Additional Paid in Capital 25.563.0 26.074.0 - Treasury Stock 0.0 0.0 + Retained Earnings 22.322.0 26,860.0 + Other Equity -9.039.0 - 11.156.0 Equity Before Minority interest 38,860.0 41,792.0 Minority/Non Controlling interest 3.917.0 4,165.0 Total Equity 42.777.0 45,957.0 Total Liabilities & Equity 227.339.0 228,037.0 Reference Items Accounting Standard US GAAP US GAAP Shares Outstanding 1.400.0 1.400.0 Number of Treasury Shares 0.0 0.0 Pension Obligations 16,908.0 18,105.0 Future Minimum Operating Lease Obligatid 1.3810 1.381.0 Capital Leases - Total 528.0 Net Debt -5.581.0 -2.877.0 Net Debt to Equity - 13.05 -6.26 Tangible Common Equity Ratio 15.01 16.37 Current Ratio 0.92 0.88 Cash Conversion Cycle 37.61 51.10 Number of employees 173 000.00 184,000.00 1,120.0 270.0 54.313.0 52,279.0 459.0 920 367.0 1.575.0 22,288.0 2,091.0 1.042.0 2.314.01 19.067.0 2.095.0 700.0 16,8720 95,569.0 100.720.0 100.720.0 Liabilities & Shareholders' Equity Payables & Accruals Accounts Payable Accrued Taxes Interest & Dividends Payable Other Payables & Accruals - ST Debt + ST Borrowings +ST Lease Liabilities + ST Finance Leases + ST Operating Lesses - Current Portion of LT Debt - Other ST Liabilities - Deferred Revenue Derivatives & Hedging + Deferred Tax Liabilities - Misc ST Liabilities Total Current Liabilities -LT Debt LT Borrowings - LT Lease Liebes +LT Finance Less +LT Operating Leases - Other LT Liabilities - Accrued Liabilities Pension Liabilities + Deferred Revenue - Deferred Tax Liabilities - Derivatives & Hedging - Misc LT Liabilities Total Noncurrent Liabilities Total Liabilities Preferred Equity and Hybrid Capital Share Capital & APIC - Common Stock - Additional Paid in Capital - Treasury Stock Retained Earnings - Other Equity Equity Before Minority Interest - Minority/Non Controlling Interest Total Equity Total Liabilities & Equity 24.135.0 0.0 14.643.0 3.985.0 5970 312.0 4.648.0 124,905.0 220,474.0 0.0 22.047.0 19,155.0 98,132.0 102,400.0 101,276.0 1.132.0 SO 1,047.0 24,767.0 0.0 15.6180 4.191.0 490.0 306.0 4.162.0 127.175.0 225.307.0 0.0 22.206.0 41.0 22,165.0 1.613.0 20,320.0 -7.728.0 33,185.0 45.0 33.230.0 266.537.0 22.006.0 1.417.0 22.663 O -7.366. 35,932.0 134.0 36,066.0 256,540.0 US GAAP 3.978.6 14,643.0 1.511.0 US GAAP 3.964.9 15.610.0 1.585.0 177.0 31.2 Reference Items Accounting Standard Shares Outstanding Pension Obligations Future Minimum Operating Lease Obligation Capital Leases - Total Options Granted During Period Options Outstanding at Period End Net Debt Net Debt to Equity Tangible Common Equity Ratio Current Ratio Cash Conversion Cycle Number of employees 13.95 -7.610.0 22.90 12.77 1.16 124.63 190.000.00 118.06 199,000.00 Income Statement General Motors Co (GM US) - Adjusted In Millions of USD except Per Share FY 2018 FY 2015 12 Months Ending 12/31/2018 12/31/2019 Revenue 147.049.0 137,237.0 - Sales & Services Revenue 133.045.0 122,6970 - Financing Revenue 14.004.0 14,540.0 - Other Revenue - Cost of Revenue 120.656.0 110.651.0 - Cost of Goods & Services 112.8560 103,851.0 - Research & Development 7.800 6,800.0 Gross Profit 26,393.0 26,586.0 Other Operating income 0.0 0.0 - Operating Expenses 18.516.0 19,184.0 - Seling. General & Admin 9.650.0 8,491.0 Research & Development 0.0 Other Operating Expense 8.066.0 10.693.0 Operating Income (Loss) 7,877.0 7.402.0 - Non-Operating (income) Loss -4.1040 - 1,955.0 - Interest Expense, Net 3200 353.0 Interest Expense 655.0 7820 - Interest income 335.0 429.0 - Foreign Exch (Gain) Loss 0.0 0.0 -Income) Loss from Artes -2.163.0 -1,268.0 + Other Non-Op Income) Loss -2.2010 -1,040.0 Pretax Income (Loss), Adjusted 11.981.0 9,357.0 - Abnormal Loss (Gains) 3.4320 1.921.0 Merger Acquisition Expense - Disposal of Assets Earty Extinguishment of Debt Asset Write-Down 5270 220 Impairment of Goodwill - Impairment of intangibles +Gain/Loss on Sale Acquisition of Busi 1640 - Legal Settlement 440.0 Restructuring 1.138.0 - Sale of investments Insurance Settlement - Other Abnormal tems 1,327,0 1.735.0 Pretax Income (Loss), GAAP 8.549.0 7.436.0 - Income Tax Expense (Beneft) 4740 769.0 Current Income Tax 902.0 Deferred Income Tax -1120 - 133.0 - (income) Loss from Affiliates Income (Loss) from Cont Ops 8.075.0 6,667.0 - Net Extraordinary Losses (Gains) 70.0 0.0 Discontinued Operations 700 - XO & Accounting Changes 0.0 0.0 Income (Loss) Incl. Mi 8,005.0 6,667.0 - Minority interest -9.0 -65.0 Net Income, GAAP 8,014.0 6,732.0 - Preferred Dividends 98.0 151.0 - Other Adjustments 0.0 0.0 Net Income Avail to Common, GAAP 7,916.01 6,581.0 Ford Motor Co (F US) - Adjusted in Millions of USD except Per Share FY 2018 FY 2019 12 Months Ending 12/31/2018 12/31/2019 Revenue 160.338.0 155,900.0 - Sales & Services Revenue 148.294.00 143,599.0 - Financing Revenue 12.018.0 12,260.0 Other Revenue 26.0 41.0 - Cost of Revenue 145,7320 144, 165.0 Cost of Goods & Services 128,069.0 127,293.0 - Cost of Financing Revenue 9,472.0 - Research & Development 8.2000 7,400.0 Gross Profit 14,606.0 11,735.0 + Other Operating income 0.0 0.0 - Operating Expenses 9.974.0 5,161,0 - Seling, General & Admin 11,403.0 11.161.0 + Research & Development 0.0 0.0 - Depreciation & Amortization -Prov For Doubtful Accts + Other Operating Expense -1,429.0 -5,000.0 Operating Income (Loss) 4,632.0 6,574.0 - Non-Operating (Income) Loss -9850 1,214,0 + Interest Expense, Net 520.0 240.0 Interest Expense 1.2280 1.0200 - Interest income 700.0 7800 +Foreign Exch (Gain) Loss 0.0 0.0 - (Income) Loss from Affiliates -1230 Other Non-Op Income) Loss - 1,390.0 1,005.0 Pretax Income (Loss), Adjusted 6,617,0 6.360.0 - Abnormal Losses (Gains) 1.272.0 6,000.0 Merger Acquisition Expense Disposal of Assets Early Extinguishment of Debt -esting Data - Asset Write-Down + Gain/Loss on Sale Acquisition of - Restructuring 5370 - Sale of investments -157.0 Other Abnormal tems 8920 6,000.0 Pretax Income (Loss), GAAP 4,345.0 -6-40.0 - Income Tax Expense (Benefit) 650.0 -724.0 + Current Income Tax 759.0 670.0 - Deferred income Tax -1090 -1,394,0 - Tax Allowance/Credit Income (Loss) from Cont Ops 3.695.0 84.0 - Net Extraordinary Losses (Gains) 00 0.0 - Discontinued Operations 0.0 0.0 - XO & Accounting Changes 0.01 00 income (Loss) incl. Mi 3,695.0 34.0 - Minority interest 18.0 370 Net Income, GAAP 3,677.0 47.0 - Preferred Dividends 0.0 0.0 - Other Adjustments 0.01 Net Income Avail to Common, GAAP 3,677.0 47.0 5880 6,949.4 Net Income Avail to Common, Adj Net Abnormal Losses (Gains) Net Extraordinary Losses (Gains) 9,791.3 1,805.31 70.0 0.0 Net Income Avail to Common, Adj Net Abnormal Losses (Gains) Net Extraordinary Losses (Gains) 5,070.0 1,393.0 0.0 4,787.0 4,740.0 00 Basic Weighted Avg Shares Basic EPS, GAAP Basic EPS from Cont Ops Basic EPS from Cont Ops, Adjusted 1,411.0 5.61 5.66 6.94 1,424.0 4.62 4.62 Basic Weighted Avg Shares Basic EPS, GAAP Basic EPS from Cont Ops Basic EPS from Cont Ops, Adjusted 3.974,0 0.93 0.93 1.28 3.9720 0.01 0.01 Diluted Weighted Avg Shares Diluted EPS, GAAP Diluted EPS from Cont Ops Diluted EPS from Cont Ops, Adjusted 1,4310 5.53 5.58 1.439.0 4.57 4.57 3,998.0 0.92 0.92 1.27 4,0040 0.01 0.01 1.19 Reference Items Accounting Standard EBITDA EBITDA Margin (T12M) EBITA EBIT Gross Margin Operating Margin Profit Margin Sales per Employee Dividends per Share Total Cash Common Dividends Captalized interest Expense Depreciation Expense Rental Expense US GAAP US GAAP 21,546,0 21,874.0 14.65 15.94 16,446.0 15,535.0 7,877.0 7.402.0 17.95 19.37 5.36 5.39 6.73 5.17 849,99422 336,810.98 1.52 1.52 2,144.7 2.164.5 Diluted Weighted Avg Shares Diluted EPS, GAAP Diluted EPS from Cont Ops Diluted EPS from Cont Ops, Adjusted Reference Items Accounting Standard EBITDA EBITDA. Margin (T12M) EBITA EBIT Gross Margin Operating Margin Proft Margin Sales per Employee Dividends per Share Total Cash Common Dividends Capitalized interest Expense Depreciation Expense Rental Expense US GAAP 14,017.0 8.74 11,513.0 4,6320 9.11 2.89 3.16 805,718.50 0.73 2.915.0 US GAAP 16.714.0 10.72 13.265.0 6.574.0 7.53 4.22 3.07 820.526 32 0.60 2,408.0 5,100.0 300.0 6,339.0 354.0 2.504.0 552.0 3,449.0 5040