

Question
Answer the questions based on the graph shown below: Fill In The Blank: [A] The dashed line ( _ _ _ _ _ _ )
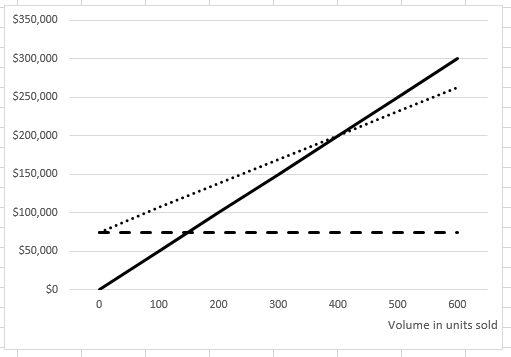
Answer the questions based on the graph shown below:
Fill In The Blank:
[A] The dashed line ( _ _ _ _ _ _ ) represents _______.
[B] The dotted line ( ......... ) represents _______.
[C] The solid line ( _______ ) represents _______.
[D] The approximate numbers of units at the break-even point is _______.
[E] In a sentence or two, describe the variable expense line. If applicable, include its relation to the other lines shown on the graph.
$350,000 $300,000 $250,000 $200,000 150,000 100,000 50,000 SO 100 200 300 400 500 600 Volume in units soldStep by Step Solution
There are 3 Steps involved in it
Step: 1

Get Instant Access to Expert-Tailored Solutions
See step-by-step solutions with expert insights and AI powered tools for academic success
Step: 2

Step: 3
Ace Your Homework with AI
Get the answers you need in no time with our AI-driven, step-by-step assistance
Get Started
Financial Accounting An Introduction
Authors: Alex Watson, Jacqui Kew
5th Edition
0190425520, 978-0190425524