

Question
Answer the questions below about the data adhering to the outlined criteria in complete sentences. Cite any outside sources that are used. Item Description 1
Answer the questions below about the data adhering to the outlined criteria in complete sentences. Cite any outside sources that are used.
| Item | Description |
| 1 | Treat the data just as you would one of the datasets from the homework. Be sure you include appropriate measures of central tendency and dispersion etc. |
| 2 | Construct a frequency distribution using 5 -8 classes. |
| 3 | Create 2 different but appropriate visual representations of the data (pie chart, bar graph, etc). You MUST use Excel to do this. |
| 4 | Complete the calculations for the 8 statistics that was identified in the worksheet in week 3. You MUST use Excel to do this. |
| 5 | Write a brief paragraph describing the meaning or interpretation for EACH of the statistics. For example, if some of the statistics chosen were the mean, median and mode, which is the best measure? |
| 6 | Construct a 95% Confidence Interval to estimate the population mean/proportion in the claim. |
| 7 | Complete the calculations for the 8 statistics that was identified in the what was conclude from the result regarding the topic? |
| 8 | Write up the responses to these questions in an APA paper |
State your topic:
Attitudes towards recycling.
Who is the population for your claim? Justify your statement:
The population for this claim is adults aged 18 and above who reside in a specific geographical area, such as a city or a neighborhood. This choice is justified because adults are more likely to have formed their own attitudes towards recycling based on their personal experiences and beliefs.
What question(s) will you ask in your survey to gather data on your claim? Explain the rationale for each question:
a) How frequently do you recycle? Rationale: This question assesses the frequency of recycling habits and provides insight into the individual's engagement with recycling practices.
b) What factors influence your decision to recycle? Rationale: This question aims to identify the key motivators behind recycling behavior, such as environmental concerns, convenience, or personal values.
c) Are you aware of the recycling facilities available in your area? Rationale: This question helps determine the respondents' knowledge about local recycling infrastructure, which could influence their recycling behavior.
d) What barriers, if any, prevent you from recycling more often? Rationale: This question aims to identify obstacles that hinder individuals from recycling regularly, such as lack of access to recycling bins or confusion about recycling guidelines.
What variables will be in your study? What type of variable are they (ordinal, nominal, discrete, continuous, etc)?
- Frequency of recycling: Ordinal variable (categories: rarely, occasionally, frequently). b) Factors influencing recycling: Nominal variable. c) Awareness of local recycling facilities: Nominal variable. d) Barriers to recycling: Nominal variable.
Where will you post your survey and how will it reach your target population? (Facebook, email, in person, etc):
The survey will be posted on social media platforms such as Facebook and Twitter, as well as distributed via email to reach the target population of adults aged 18 and above. Additionally, physical copies of the survey will be made available in public places like libraries and community centers.
How will you collect your data? (Survey Monkey, Facebook Question, By hand/Excel, etc):
Data will be collected using an online survey platform such as SurveyMonkey or Google Forms. The responses can be exported to a spreadsheet program like Excel for further analysis.
What type of sampling method will you use? Justify your choice and cite a reference supporting your decision:
The sampling method chosen for this study will be convenient sampling. Convenience sampling is a non-probability sampling technique that selects individuals who are easily accessible and readily available to participate in the survey. In this case, the survey will be distributed online and in public places, making it convenient for individuals to participate. Although convenience sampling may introduce bias and limit the generalizability of the findings, it is a practical choice given the limited resources and time constraints of a mini study.
What 2 types of graphs that you have learned about are the most appropriate for your data? Justify your statement and cite a reference supporting your decision:
- Bar chart:
A bar chart is suitable for displaying categorical data, such as the frequency of recycling (ordinal variable). It allows for easy visual comparison between different categories and provides a clear representation of the distribution of responses.
- Pie chart:
A pie chart is appropriate for displaying the distribution of factors influencing recycling (nominal variable) or the awareness of local recycling facilities (nominal variable). It allows for a visual representation of the proportion of each category in relation to the whole.
What 8 descriptive statistics that you have learned about are the most appropriate for your data? Justify your statement and cite a reference supporting your decision:
a) Mean: The mean can be used to calculate the average frequency of recycling, providing a measure of central tendency.
b) Median: The median can be used to determine the middle value of the frequency of recycling, which helps assess the distribution's central tendency, especially if there are outliers.
c) Mode: The mode can identify the most frequently occurring factors influencing recycling, providing insights into the common motivators.
d) Percentages: Percentages can be used to represent the distribution of factors influencing recycling or barriers to recycling, allowing for a clear understanding of the relative importance of each category.
e) Range: The range can provide information on the variability of the frequency of recycling, indicating the difference between the highest and lowest values.
f) Standard deviation: The standard deviation can assess the spread or dispersion of responses for the frequency of recycling, indicating the average distance from the mean.
g) Frequency distribution: Creating a frequency distribution table can organize the responses and display the number of individuals falling into different categories for factors influencing recycling or barriers to recycling.
h) Cross-tabulation: Cross-tabulation can help analyze the relationship between two variables, such as factors influencing recycling and awareness of local recycling facilities, providing insights into possible associations.
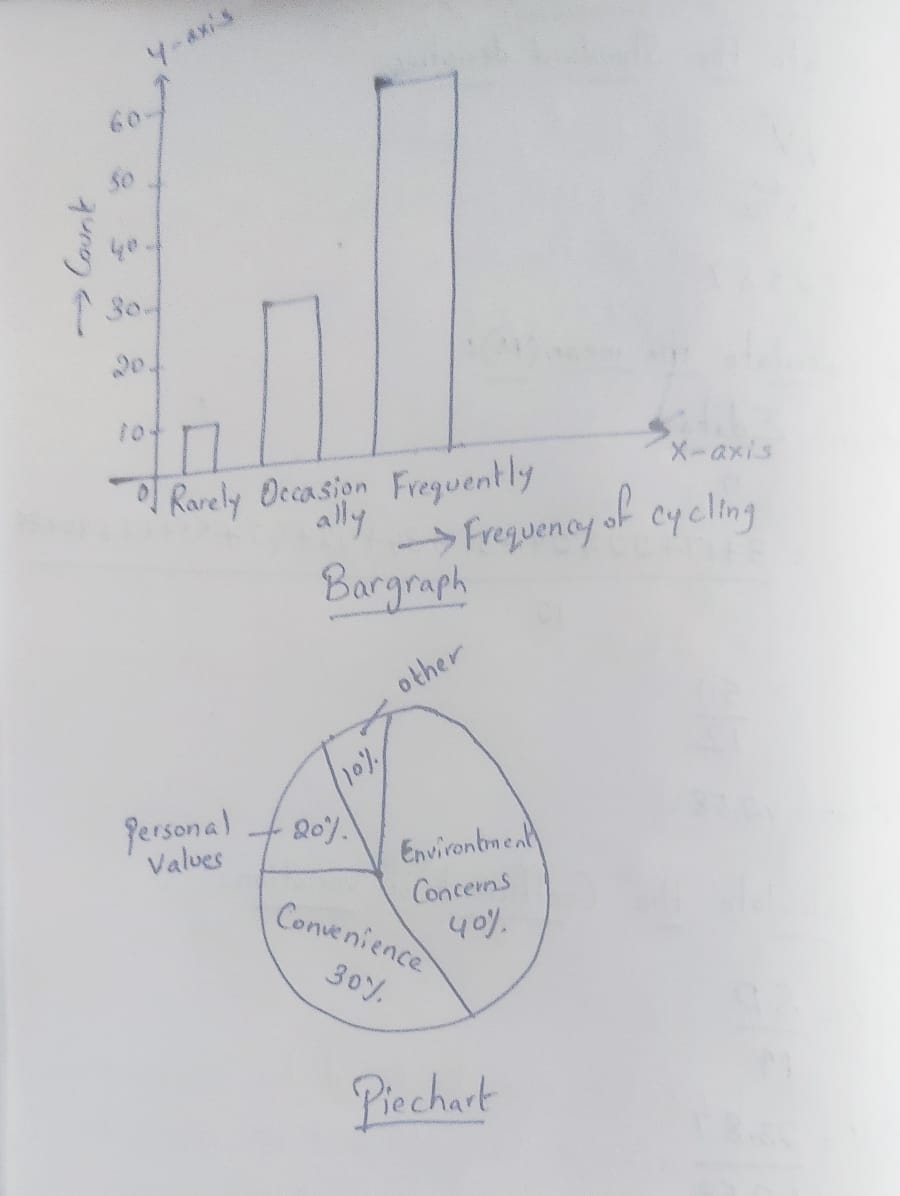 GO so Count So 104 of Rarely Occasion Frequently X-axis ally -Frequency of cycling Bargraph other 10 % Personal Values Environment Concerns Convenience 40% 30y Piechart
 Step by Step Solution
There are 3 Steps involved in it
Step: 1

Get Instant Access to Expert-Tailored Solutions
See step-by-step solutions with expert insights and AI powered tools for academic success
Step: 2

Step: 3
Ace Your Homework with AI
Get the answers you need in no time with our AI-driven, step-by-step assistance
Get Started
Linear Algebra
Authors: Jim Hefferon
1st Edition
978-0982406212, 0982406215