Answer the questions below: The data for this question is down at the bottom:
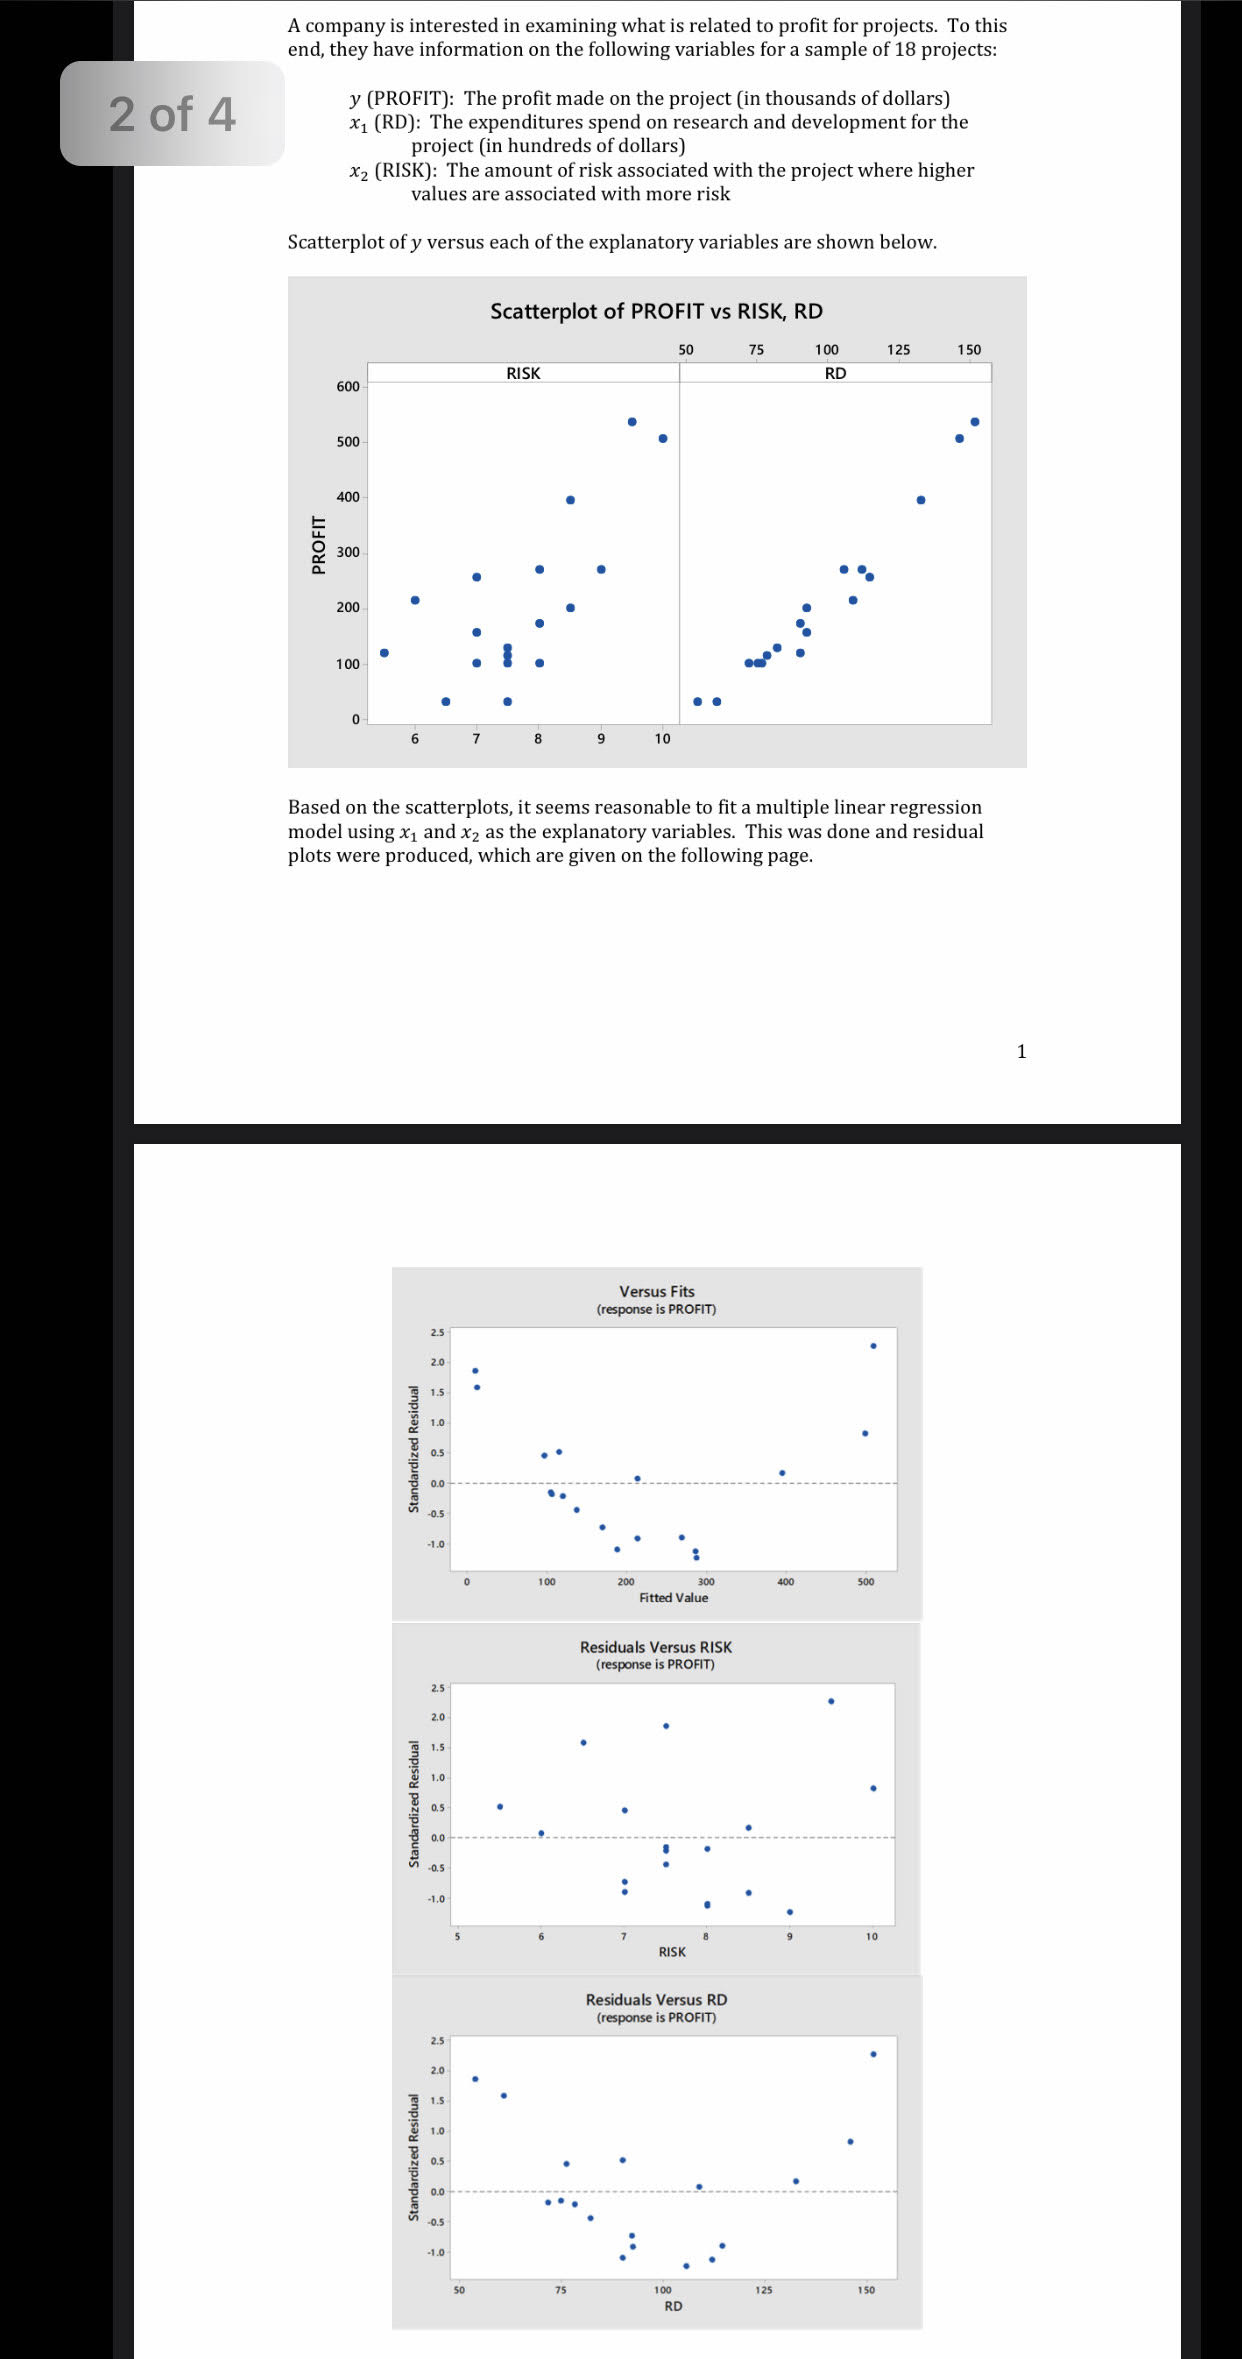
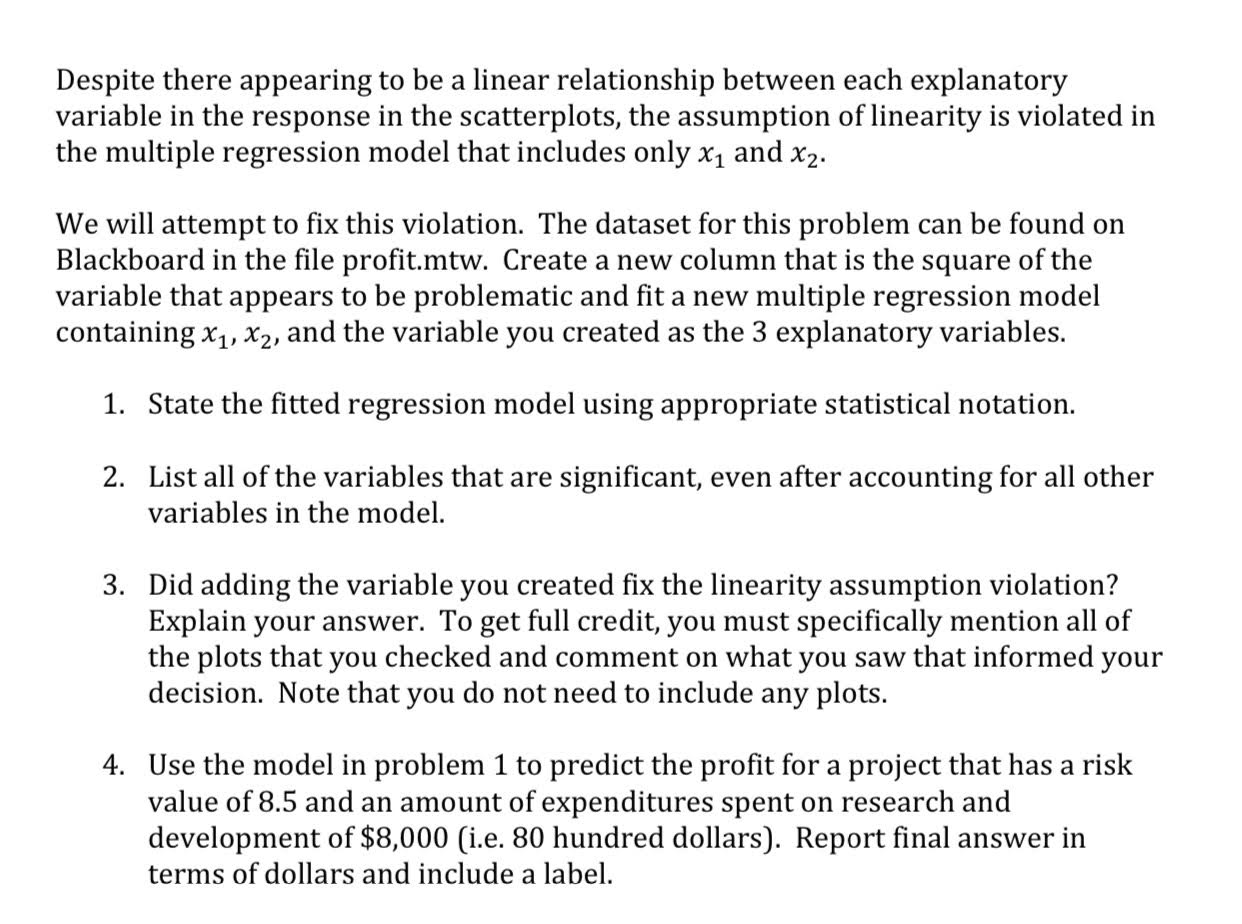
A company is interested in examining what is related to profit for projects. To this end, they have information on the following variables for a sample of 18 projects: 2 of 4 y (PROFIT): The profit made on the project (in thousands of dollars) x1 (RD): The expenditures spend on research and development for the project (in hundreds of dollars) x2 (RISK): The amount of risk associated with the project where higher values are associated with more risk Scatterplot of y versus each of the explanatory variables are shown below. Scatterplot of PROFIT vs RISK, RD 50 75 100 125 150 RISK RD 600 500 400 PROFIT 300 200 100 10 Based on the scatterplots, it seems reasonable to fit a multiple linear regression model using x1 and x2 as the explanatory variables. This was done and residual plots were produced, which are given on the following page. Versus Fits (response is PROFIT) Standardized Residual 10 100 200 Fitted Value 400 500 Residuals Versus RISK (response is PROFIT) Standardized Residual 1.0 10 RISK Residuals Versus RD (response is PROFIT) Standardized Residual 10 75 .00 125 150 RDDeSpite there appearing to be a linear relationship between each explanatory variable in the response in the scatterplots, the assumption of linearity is violated in the multiple regression model that includes only x1 and x2. We will attempt to fix this violation. The dataset for this problem can be found on Blackboard in the file protmtw. Create a new column that is the square of the variable that appears to be problematic and fit a new multiple regression model containing x1, x2, and the variable you created as the 3 explanatory variables. 1. State the tted regression model using appropriate statistical notation. 2. List all of the variables that are significant, even after accounting for all other variables in the model. 3. Did adding the variable you created fix the linearity assumption violation? Explain your answer. To get full credit, you must specically mention all of the plots that you checked and comment on what you saw that informed your decision. Note that you do not need to include any plots. 4-. Use the model in problem 1 to predict the prot for a project that has a risk value of 8.5 and an amount of expenditures spent on research and development of $8,000 (Le. 80 hundred dollars). Report nal answer in terms of dollars and include a label


