

Answered step by step
Verified Expert Solution
Question
1 Approved Answer
answer the questions on the basis of following ratios shown in the picture below 4. What is the overall market/economic trend over these three years?
answer the questions on the basis of following ratios shown in the picture below
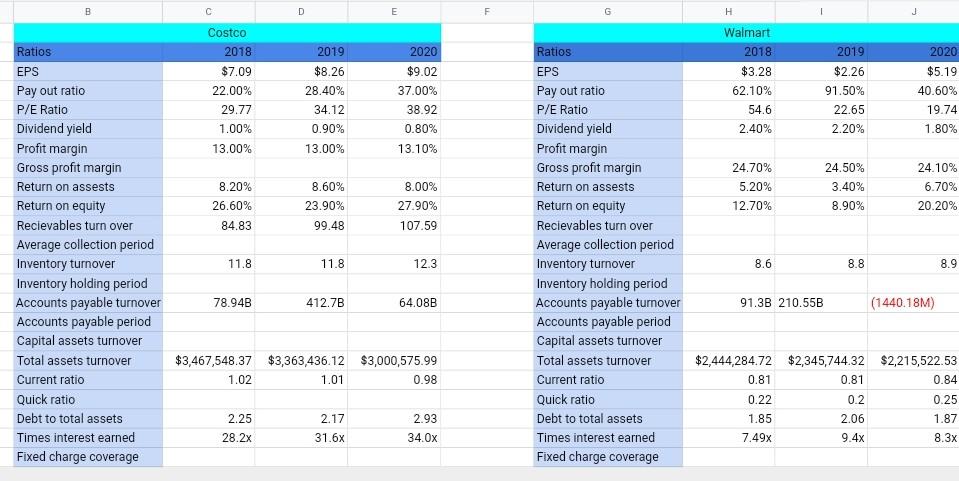
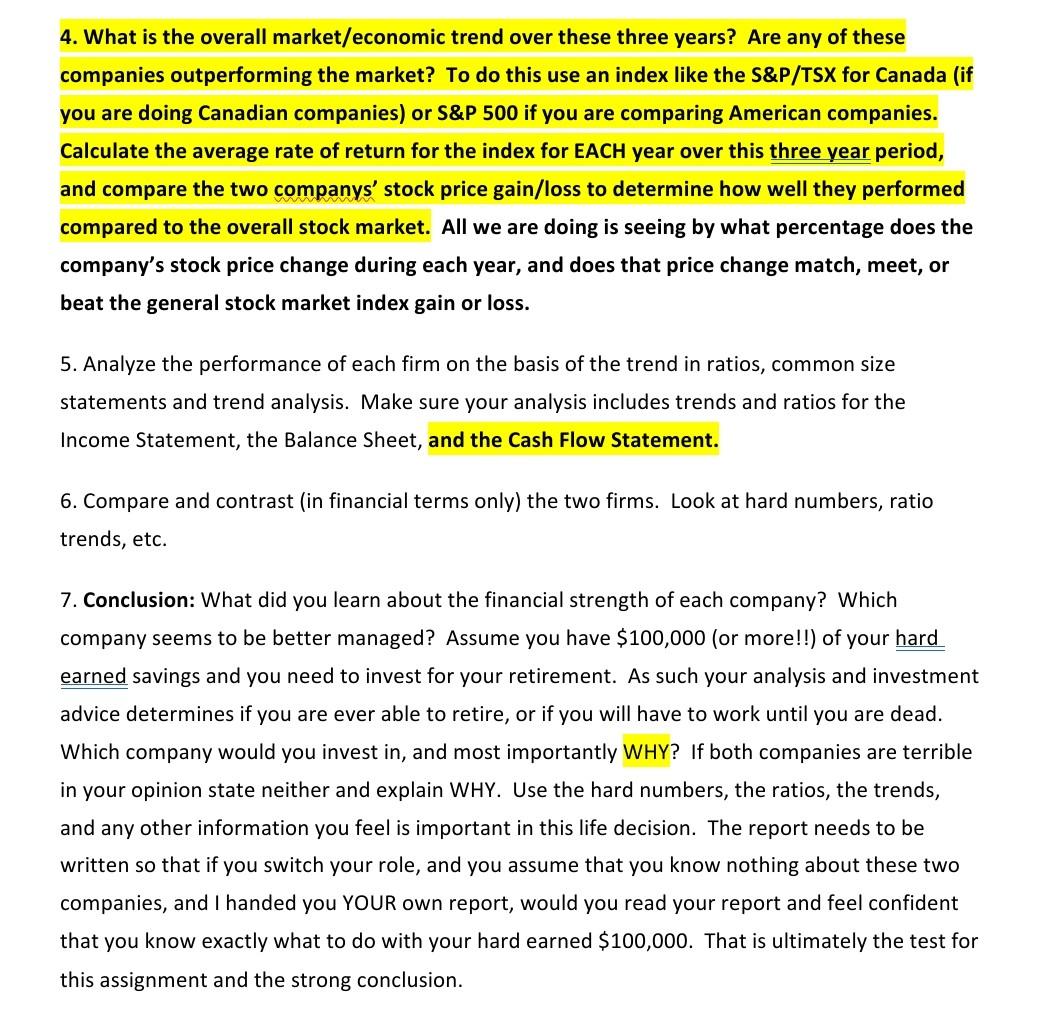
4. What is the overall market/economic trend over these three years? Are any of these companies outperforming the market? To do this use an index like the S&P/TSX for Canada (if you are doing Canadian companies) or S&P 500 if you are comparing American companies. Calculate the average rate of return for the index for EACH year over this three year period, and compare the two companys' stock price gain/loss to determine how well they performed compared to the overall stock market. All we are doing is seeing by what percentage does the company's stock price change during each year, and does that price change match, meet, or beat the general stock market index gain or loss. 5. Analyze the performance of each firm on the basis of the trend in ratios, common size statements and trend analysis. Make sure your analysis includes trends and ratios for the Income Statement, the Balance Sheet, and the Cash Flow Statement. 6. Compare and contrast (in financial terms only) the two firms. Look at hard numbers, ratio trends, etc. 7. Conclusion: What did you learn about the financial strength of each company? Which company seems to be better managed? Assume you have $100,000 (or more!!) of your hard earned savings and you need to invest for your retirement. As such your analysis and investment advice determines if you are ever able to retire, or if you will have to work until you are dead. Which company would you invest in, and most importantly WHY? If both companies are terrible in your opinion state neither and explain WHY. Use the hard numbers, the ratios, the trends, and any other information you feel is important in this life decision. The report needs to be written so that if you switch your role, and you assume that you know nothing about these two companies, and I handed you YOUR own report, would you read your report and feel confident that you know exactly what to do with your hard earned $100,000. That is ultimately the test for this assignment and the strong conclusion. B D E F H J Ratios 2019 2020 2019 $8.26 Costco 2018 $7.09 22.00% 29.77 1.00% 13.00% Walmart 2018 $3.28 62.10% 54.6 2.40% $9.02 37.00% 38.92 0.80% 13.10% 28.40% 34.12 0.90% 13.00% $2.26 91.50% 22.65 2.20% 2020 $5.19 40.60% 19.74 1.80% 24.10% 24.70% 5.20% 8.60% 8.00% 24.50% 3.40% 8.90% 8.20% 26.60% 6.70% 23.90% 27.90% 12.70% 20.20% 84.83 99.48 107.59 EPS Pay out ratio P/E Ratio Dividend yield Profit margin Gross profit margin Return on assests Return on equity Recievables turn over Average collection period Inventory turnover Inventory holding period Accounts payable turnover Accounts payable period Capital assets turnover Total assets turnover Current ratio Quick ratio Debt to total assets Times interest earned Fixed charge coverage Ratios EPS Pay out ratio P/E Ratio Dividend yield Profit margin Gross profit margin Return on assests Return on equity Recievables turn over Average collection period Inventory turnover Inventory holding period Accounts payable turnover Accounts payable period Capital assets turnover Total assets turnover Current ratio Quick ratio Debt to total assets Times interest earned Fixed charge coverage 11.8 11.8 12.3 8.6 8.8 8.9 78.94B 412.7B 64.08B 91.3B 210.55B (1440.18M) $3,467,548.37 $3,363,436.12 $3,000,575.99 1.02 1.01 0.98 $2,444,284.72 $2,345,744.32 $2,215,522.53 0.81 0.81 0.84 0.22 0.2 0.25 1.85 2.06 1.87 7.49x 9.4x 8.3x 2.17 2.25 28.2x 2.93 34.Ox 31.6x 4. What is the overall market/economic trend over these three years? Are any of these companies outperforming the market? To do this use an index like the S&P/TSX for Canada (if you are doing Canadian companies) or S&P 500 if you are comparing American companies. Calculate the average rate of return for the index for EACH year over this three year period, and compare the two companys' stock price gain/loss to determine how well they performed compared to the overall stock market. All we are doing is seeing by what percentage does the company's stock price change during each year, and does that price change match, meet, or beat the general stock market index gain or loss. 5. Analyze the performance of each firm on the basis of the trend in ratios, common size statements and trend analysis. Make sure your analysis includes trends and ratios for the Income Statement, the Balance Sheet, and the Cash Flow Statement. 6. Compare and contrast (in financial terms only) the two firms. Look at hard numbers, ratio trends, etc. 7. Conclusion: What did you learn about the financial strength of each company? Which company seems to be better managed? Assume you have $100,000 (or more!!) of your hard earned savings and you need to invest for your retirement. As such your analysis and investment advice determines if you are ever able to retire, or if you will have to work until you are dead. Which company would you invest in, and most importantly WHY? If both companies are terrible in your opinion state neither and explain WHY. Use the hard numbers, the ratios, the trends, and any other information you feel is important in this life decision. The report needs to be written so that if you switch your role, and you assume that you know nothing about these two companies, and I handed you YOUR own report, would you read your report and feel confident that you know exactly what to do with your hard earned $100,000. That is ultimately the test for this assignment and the strong conclusion. B D E F H J Ratios 2019 2020 2019 $8.26 Costco 2018 $7.09 22.00% 29.77 1.00% 13.00% Walmart 2018 $3.28 62.10% 54.6 2.40% $9.02 37.00% 38.92 0.80% 13.10% 28.40% 34.12 0.90% 13.00% $2.26 91.50% 22.65 2.20% 2020 $5.19 40.60% 19.74 1.80% 24.10% 24.70% 5.20% 8.60% 8.00% 24.50% 3.40% 8.90% 8.20% 26.60% 6.70% 23.90% 27.90% 12.70% 20.20% 84.83 99.48 107.59 EPS Pay out ratio P/E Ratio Dividend yield Profit margin Gross profit margin Return on assests Return on equity Recievables turn over Average collection period Inventory turnover Inventory holding period Accounts payable turnover Accounts payable period Capital assets turnover Total assets turnover Current ratio Quick ratio Debt to total assets Times interest earned Fixed charge coverage Ratios EPS Pay out ratio P/E Ratio Dividend yield Profit margin Gross profit margin Return on assests Return on equity Recievables turn over Average collection period Inventory turnover Inventory holding period Accounts payable turnover Accounts payable period Capital assets turnover Total assets turnover Current ratio Quick ratio Debt to total assets Times interest earned Fixed charge coverage 11.8 11.8 12.3 8.6 8.8 8.9 78.94B 412.7B 64.08B 91.3B 210.55B (1440.18M) $3,467,548.37 $3,363,436.12 $3,000,575.99 1.02 1.01 0.98 $2,444,284.72 $2,345,744.32 $2,215,522.53 0.81 0.81 0.84 0.22 0.2 0.25 1.85 2.06 1.87 7.49x 9.4x 8.3x 2.17 2.25 28.2x 2.93 34.Ox 31.6x
Step by Step Solution
There are 3 Steps involved in it
Step: 1

Get Instant Access to Expert-Tailored Solutions
See step-by-step solutions with expert insights and AI powered tools for academic success
Step: 2

Step: 3
Ace Your Homework with AI
Get the answers you need in no time with our AI-driven, step-by-step assistance
Get Started
Contemporary Issues In Finance
Authors: Simon Grima, Frank Bezzina, Inna Romanova
1st Edition
1786359073, 978-1786359070