Answer the whole thing will excel and Minitab work
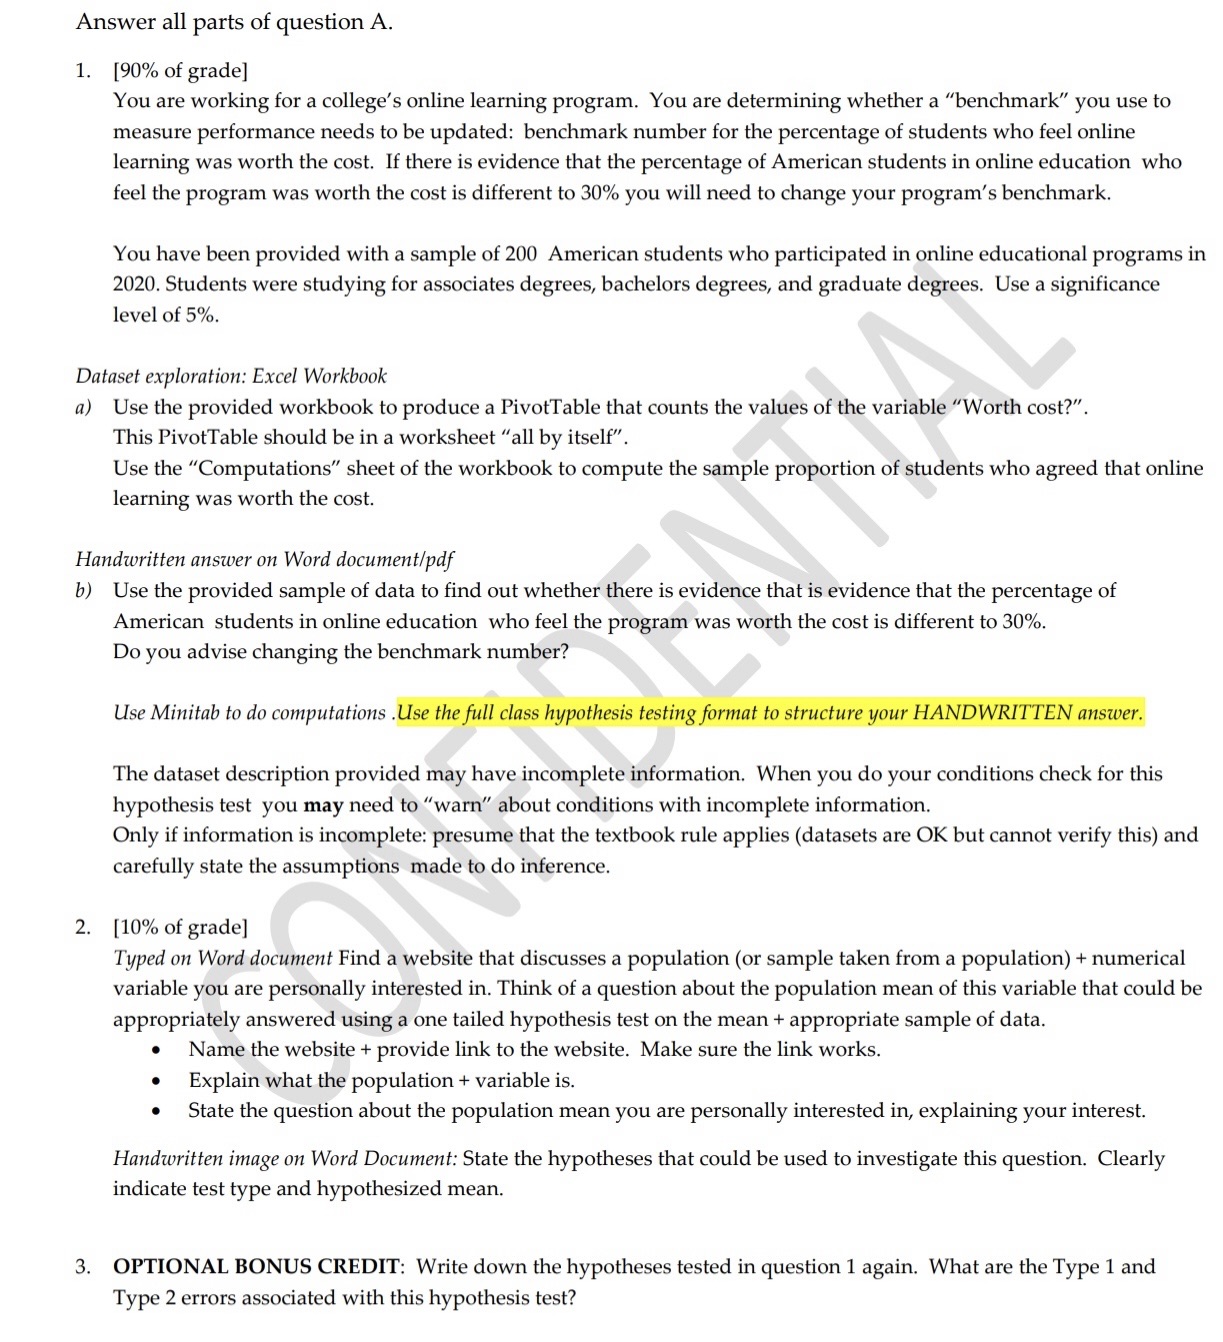
Answer all parts of question A. 1. [90% of grade] You are working for a college's online learning program. You are determining whether a "benchmark\" you use to measure performance needs to be updated: benchmark number for the percentage of students who feel online learning was worth the cost. If there is evidence that the percentage of American students in online education who feel the program was worth the cost is different to 30% you will need to change your program's benchmark. You have been provided with a sample of 200 American students who participated in online educational programs in 2020. Students were studying for associates degrees, bachelors degrees, and graduate degrees. Use a significance level of 5%. Dataset exploration: Excel Workbook a) Use the provided workbook to produce a PivotTable that counts the values of the variable \"Worth cost?\". This PivotTable should be in a worksheet \"all by itself". Use the \"Computations" sheet of the workbook to compute the sample proportion of students who agreed that online learning was worth the cost. Handwritten answer on Word documen t/pdf b) Use the provided sample of data to find out whether there is evidence that is evidence that the percentage of American students in online education who feel the program was worth the cost is different to 30%. Do you advise changing the benchmark number? Use Minitab to do computations .Usc thefuii class hypothesis testing rrmat to structure your HANDWRITTEN answer. The dataset description provided may have incomplete information. When you do your conditions check for this hypothesis test you may need to "warn\" about conditions with incomplete information. Only if information is incomplete: presume that the textbook rule applies (datasets are OK but cannot verify this) and carefully state the assumptions made to do inference. 2. [10% of grade] Typed on WorstI document Find a website that discusses a population (or sample taken from a population) + numerical variable you are personally interested in. Think of a question about the population mean of this variable that could be appropriately answered using a one tailed hypothesis test on the mean + appropriate sample of data. 0 Name the website + provide link to the website. Make sure the link works. 0 Explain what the population + variable is. 0 State the question about the population mean you are personally interested in, explaining your interest. Handwritten image on Word Document: State the hypotheses that could be used to investigate this question. Clearly indicate test type and hypothesized mean. 3. OPTIONAL BONUS CREDIT: Write down the hypotheses tested in question 1 again. What are the Type 1 and Type 2 errors associated with this hypothesis test


