answers
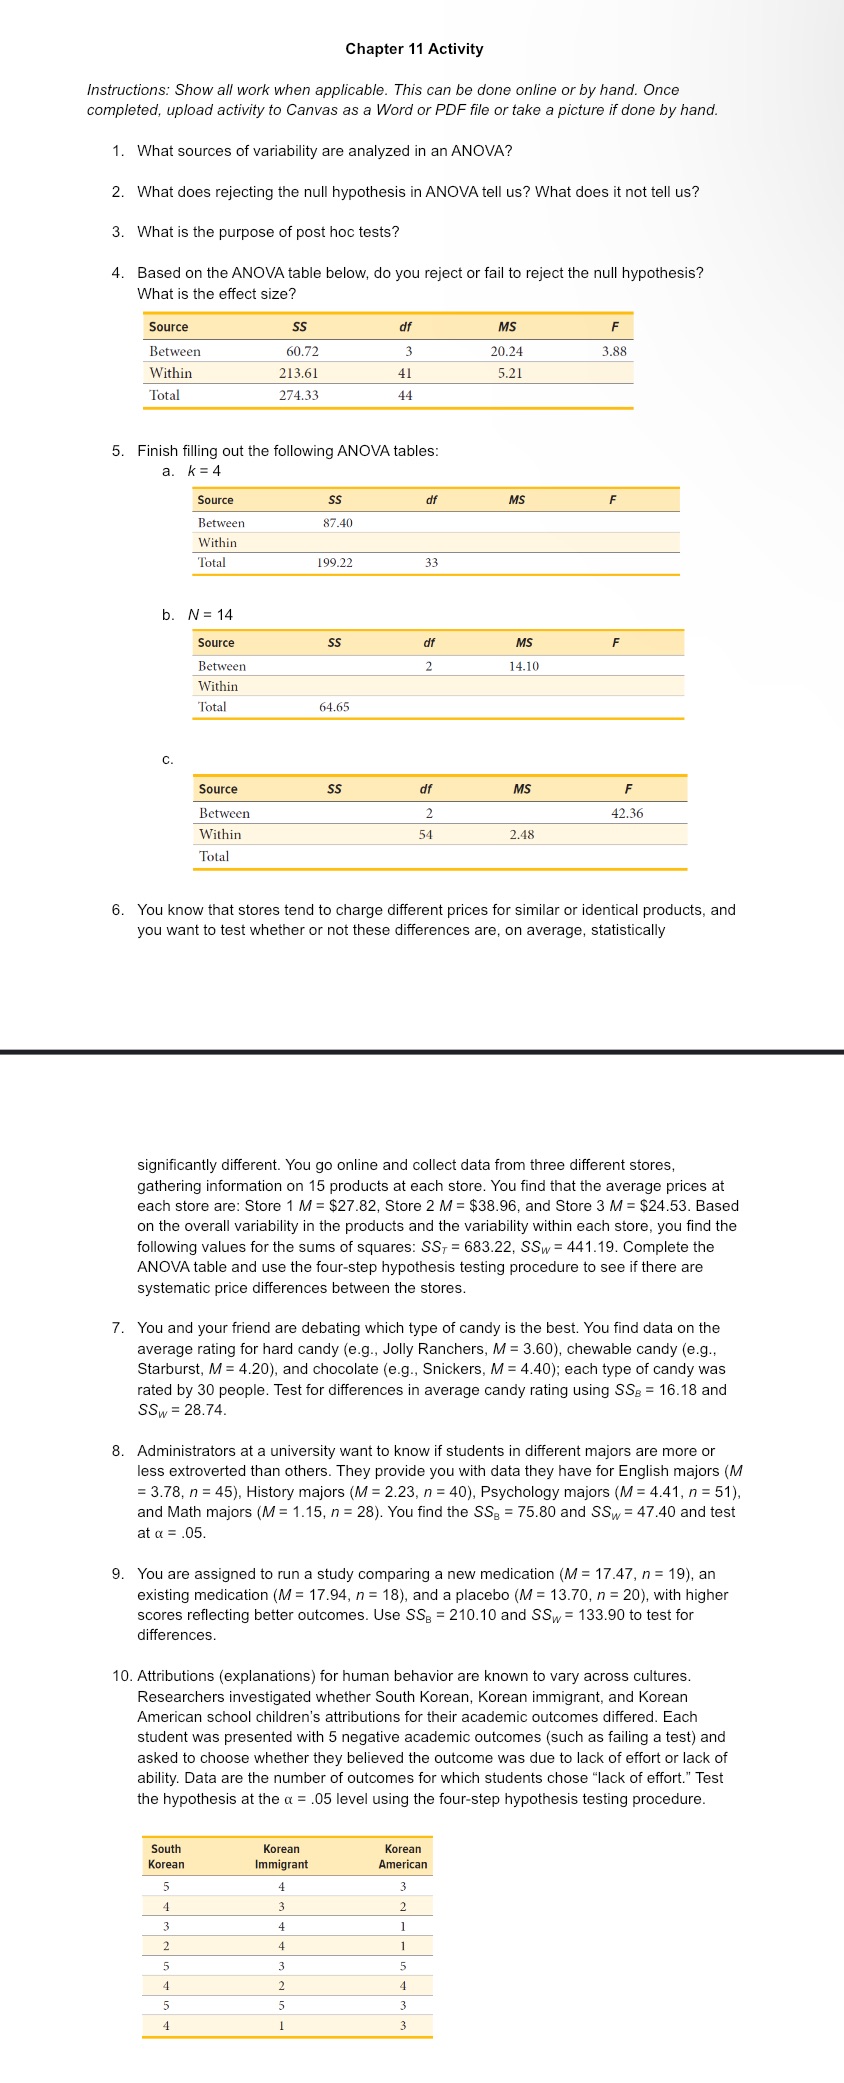
Chapter 11 Activity Instructions: Show all work when applicable. This can be done online or by hand. Once completed, upload activity to Canvas as a Word or PDF file or take a picture if done by hand. 1. What sources of variability are analyzed in an ANOVA? 2. What does rejecting the null hypothesis in ANOVA tell us? What does it not tell us? 3. What is the purpose of post hoc tests? 4. Based on the ANOVA table below, do you reject or fail to reject the null hypothesis? What is the effect size? Source 55 df Ms e Between 3 20.24 3.88 Within 41 5.21 Total 44 5. Finish filling out the following ANOVA tables: a. k=4 Source 55 df M5 F Between 87.40 Within lotal 199.22 33 b. N=14 Source 55 df Ms F Between 2 14.10 Within Total 64.65 c. Source S5 df Ms F Between 2 42.36 Within 54 248 Total 6. You know that stores tend to charge different prices for similar or identical products, and you want to test whether or not these differences are, on average, statistically significantly different. You go online and collect data from three different stores, gathering information on 15 products at each store. You find that the average prices at each store are: Store 1 M = $27.82, Store 2 M = $38.96, and Store 3 M = $24.53. Based on the overall variability in the products and the variability within each store, you find the following values for the sums of squares: $Sy = 683.22, S5, = 441.19. Complete the ANOVA table and use the four-step hypothesis testing procedure to see if there are systematic price differences between the stores. 7. You and your friend are debating which type of candy is the best. You find data on the average rating for hard candy (e.g., Jolly Ranchers, M = 3.60), chewable candy (e.g., Starburst, M = 4.20), and chocolate (e.g., Snickers, M = 4.40); each type of candy was rated by 30 people. Test for differences in average candy rating using SSg = 16.18 and 55, = 28.74. 8. Administrators at a university want to know if students in different majors are more or less extroverted than others. They provide you with data they have for English majors (M = 3.78, n = 45), History majors (M = 2.23, n = 40), Psychology majors (M = 4.41, n = 51), and Math majors (M = 1.15, n = 28). You find the S5 = 75.80 and SS,, = 47.40 and test ata=.05. 9. You are assigned to run a study comparing a new medication (M = 17.47, n = 19), an existing medication (M = 17.94, n = 18), and a placebo (M = 13.70, n = 20), with higher scores reflecting better outcomes. Use SS; = 210.10 and S5, = 133.90 to test for differences. 10. Attributions (explanations) for human behavior are known to vary across cultures. Researchers investigated whether South Korean, Korean immigrant, and Korean American school children's attributions for their academic outcomes differed. Each student was presented with 5 negative academic outcomes (such as failing a test) and asked to choose whether they believed the outcome was due to lack of effort or lack of ability. Data are the number of outcomes for which students chose \"lack of effort.\" Test the hypothesis at the = .05 level using the four-step hypothesis testing procedure. South Korean Korean Korean Immigrant American 4 3 4 3 | 3 4 1 2 4 1 5 3 5 4 2 4 5 3 3 2 1 3