answers
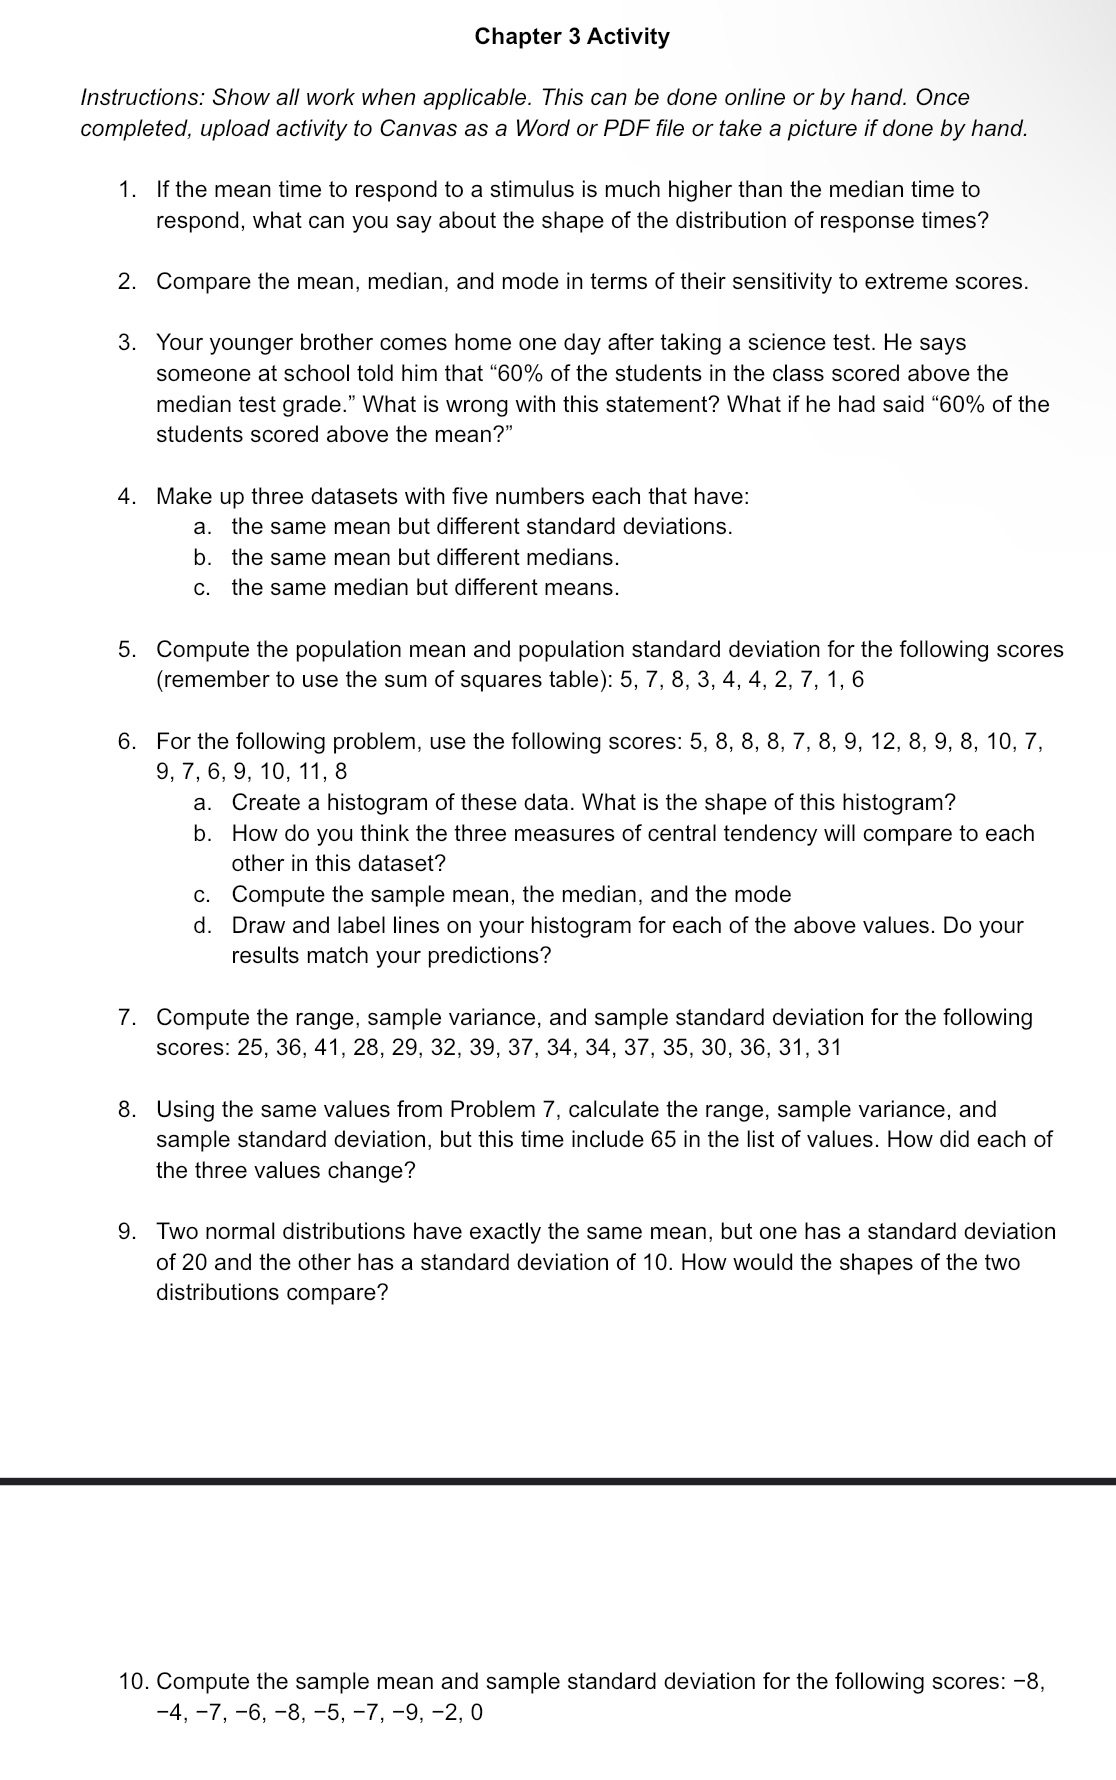
Chapter 3 Activity Instructions: Show all work when applicable. This can be done online or by hand. Once completed, upload activity to Canvas as a Word or PDF file or take a picture if done by hand. 1. If the mean time to respond to a stimulus is much higher than the median time to respond, what can you say about the shape of the distribution of response times? 2. Compare the mean, median, and mode in terms of their sensitivity to extreme scores. 3. Your younger brother comes home one day after taking a science test. He says someone at school told him that \"60% of the students in the class scored above the median test grade.\" What is wrong with this statement? What if he had said \"60% of the students scored above the mean?\" 4. Make up three datasets with five numbers each that have: a. the same mean but different standard deviations. b. the same mean but different medians. c. the same median but different means. 5. Compute the population mean and population standard deviation for the following scores (remember to use the sum of squares table): 5,7,8,3,4,4,2, 7,1, 6 6. For the following problem, use the following scores: 5, 8, 8, 8,7, 8,9, 12, 8,9, 8, 10, 7, 9,7,6,9,10,11,8 a. Create a histogram of these data. What is the shape of this histogram? b. How do you think the three measures of central tendency will compare to each other in this dataset? c. Compute the sample mean, the median, and the mode d. Draw and label lines on your histogram for each of the above values. Do your results match your predictions? 7. Compute the range, sample variance, and sample standard deviation for the following scores: 25, 36, 41, 28, 29, 32, 39, 37, 34, 34, 37, 35, 30, 36, 31, 31 8. Using the same values from Problem 7, calculate the range, sample variance, and sample standard deviation, but this time include 85 in the list of values. How did each of the three values change? 9. Two normal distributions have exactly the same mean, but one has a standard deviation of 20 and the other has a standard deviation of 10. How would the shapes of the two distributions compare? 10. Compute the sample mean and sample standard deviation for the following scores: -8, -4,-7,-6,-8,-5,-7,-9,-2,0


