answers
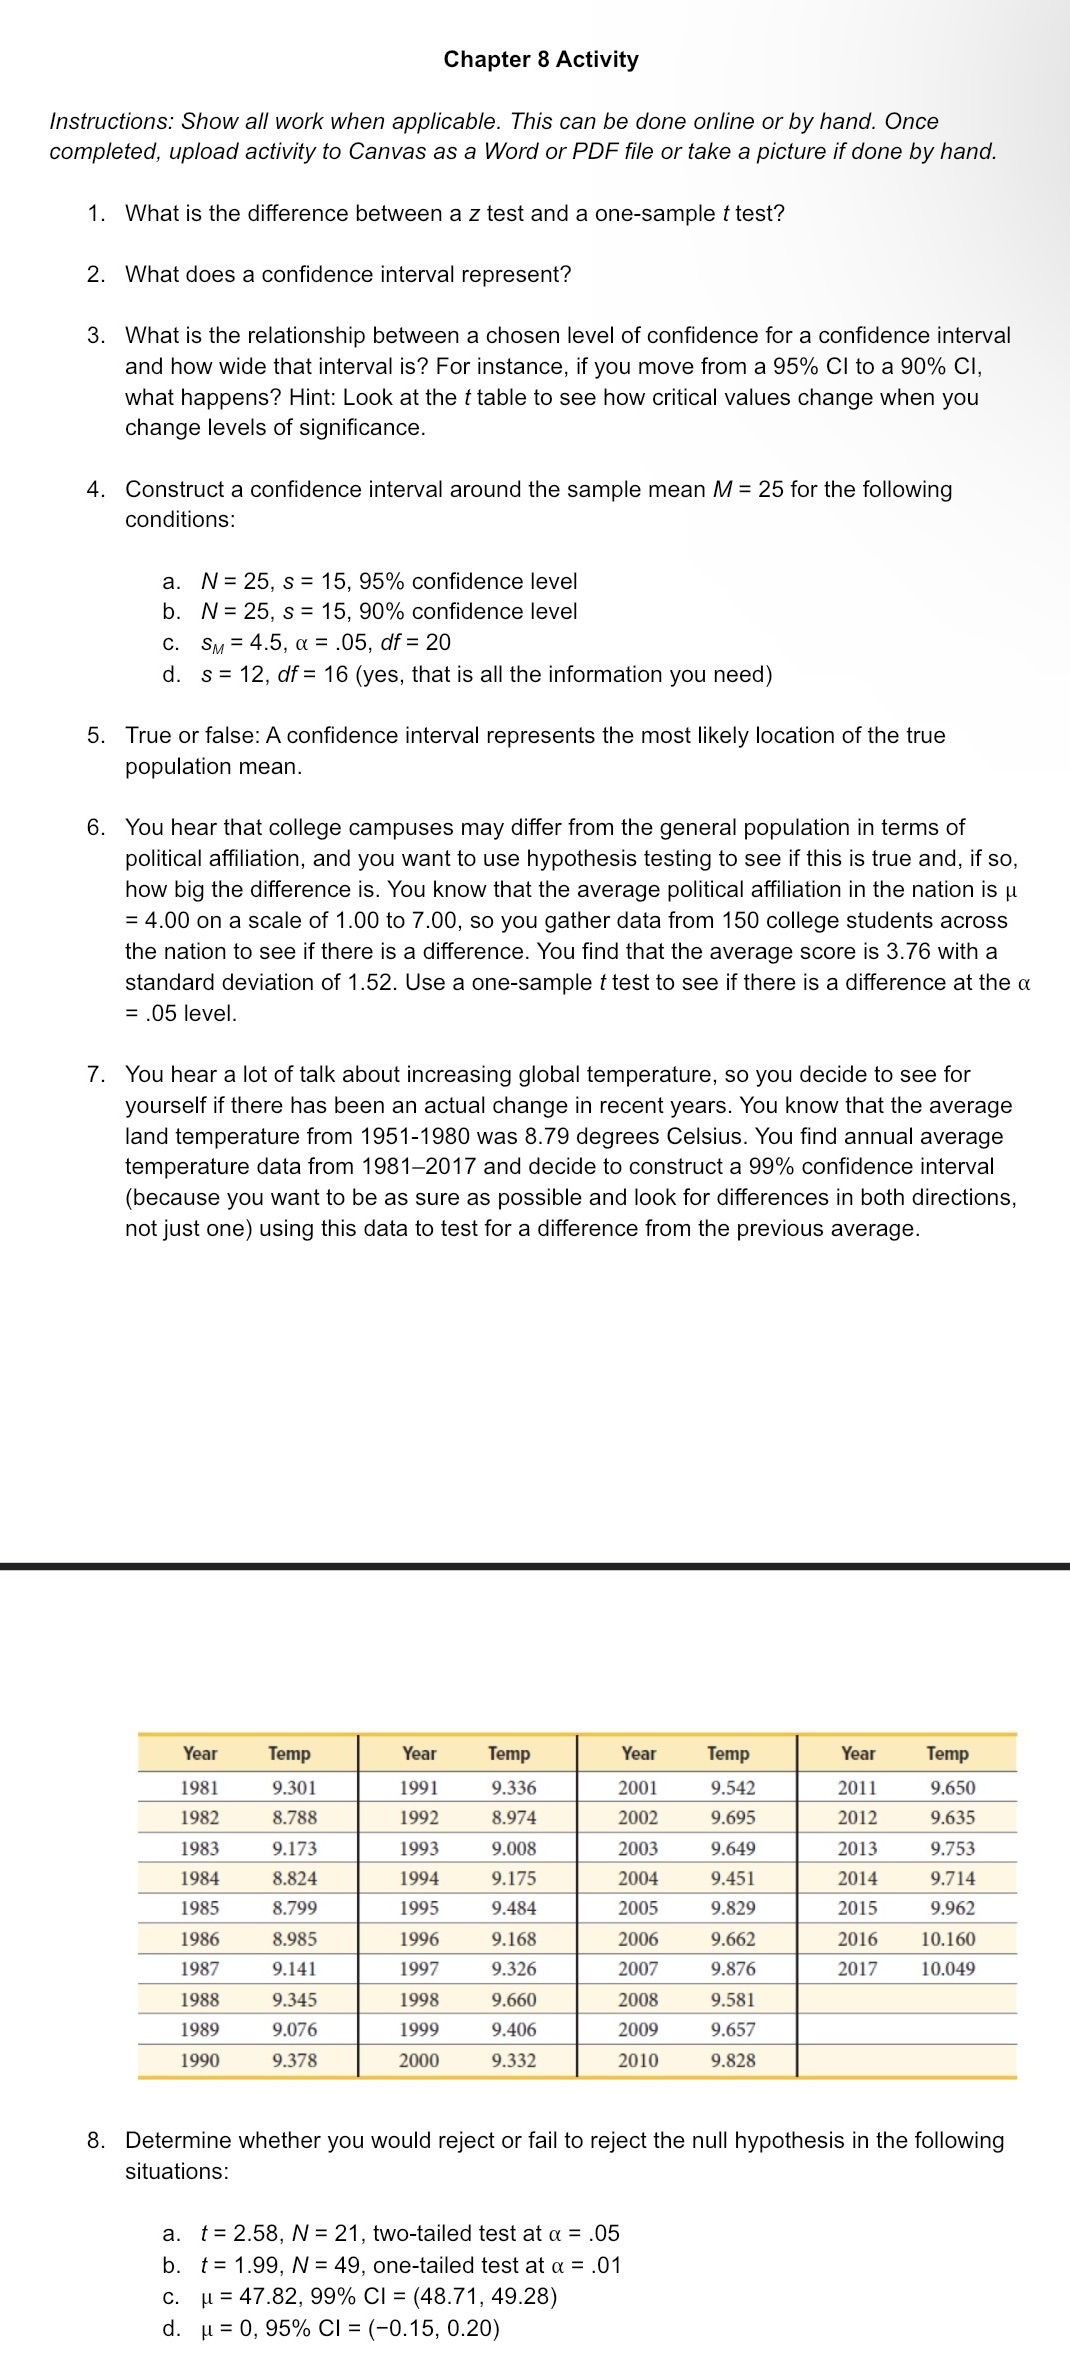
Chapter 8 Activity Instructions: Show all work when applicable. This can be done online or by hand. Once completed, upload activity to Canvas as a Word or PDF file or take a picture if done by hand. 1. What is the difference between a z test and a one-sample { test? 2. What does a confidence interval represent? 3. Whatis the relationship between a chosen level of confidence for a confidence interval and how wide that interval is? For instance, if you move from a 95% Cl to a 90% Cl, what happens? Hint: Look at the table to see how critical values change when you change levels of significance. 4. Construct a confidence interval around the sample mean M = 25 for the following conditions: a. N=25,s=15, 95% confidence level b. N=25,s=15, 90% confidence level c. Sy=4.5 a=.05df=20 d. s=12, df = 16 (yes, that is all the information you need) 5. True or false: A confidence interval represents the most likely location of the true population mean. 6. You hear that college campuses may differ from the general population in terms of political affiliation, and you want to use hypothesis testing to see if this is true and, if so, how big the difference is. You know that the average political affiliation in the nation is p =4.00 on a scale of 1.00 to 7.00, so you gather data from 150 college students across the nation to see if there is a difference. You find that the average score is 3.76 with a standard deviation of 1.52. Use a one-sample t test to see if there is a difference at the =.05 level. 7. You hear a lot of talk about increasing global temperature, so you decide to see for yourself if there has been an actual change in recent years. You know that the average land temperature from 1951-1980 was 8.79 degrees Celsius. You find annual average temperature data from 1981-2017 and decide to construct a 99% confidence interval (because you want to be as sure as possible and look for differences in both directions, not just one) using this data to test for a difference from the previous average. Year Temp Year Temp Year Temp Year Temp 1981 9.301 1991 9.336 2001 9.542 2011 9.650 1982 8.788 1992 8.974 2002 9.695 2012 9.635 1983 9.173 1993 9.008 2003 9.649 2013 9.753 1984 8.824 1994 9.175 2004 9.451 2014 9714 1985 8.799 1995 9.484 2005 9.829 2015 9.962 1986 8.985 1996 9.168 2006 9.662 2016 10.160 1987 9.141 1997 9.326 2007 9.876 2017 10.049 1988 9.345 1998 9.660 2008 9.581 1989 9.076 1999 9.406 2009 9.657 1990 9.378 2000 9.332 2010 9.828 8. Determine whether you would reject or fail to reject the null hypothesis in the following situations: a. t=2.58, N=21, two-tailed test at = .05 b. t=1.99, N =49, one-tailed test at = .01 c. n=47.82,99% Cl = (48.71, 49.28) d. p=0,95% Cl=(-0.15, 0.20)