Answered step by step
Verified Expert Solution
Question
1 Approved Answer
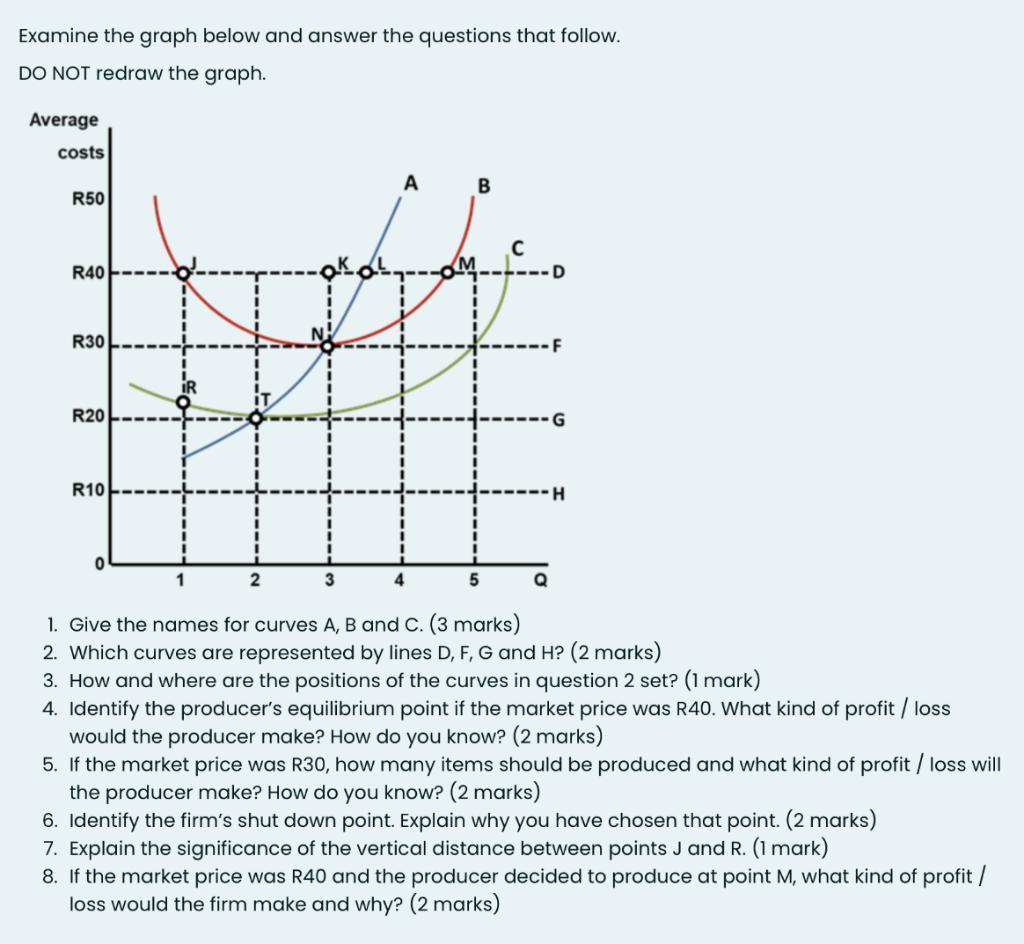
Examine the graph below and answer the questions that follow. DO NOT redraw the graph. Average costs R50 R40 R30 R20 R10 0 2

Examine the graph below and answer the questions that follow. DO NOT redraw the graph. Average costs R50 R40 R30 R20 R10 0 2 3 A 4 M B 5 -F G H 1. Give the names for curves A, B and C. (3 marks) 2. Which curves are represented by lines D, F, G and H? (2 marks) 3. How and where are the positions of the curves in question 2 set? (1 mark) 4. Identify the producer's equilibrium point if the market price was R40. What kind of profit / loss would the producer make? How do you know? (2 marks) 5. If the market price was R30, how many items should be produced and what kind of profit / loss will the producer make? How do you know? (2 marks) 6. Identify the firm's shut down point. Explain why you have chosen that point. (2 marks) 7. Explain the significance of the vertical distance between points J and R. (1 mark) 8. If the market price was R40 and the producer decided to produce at point M, what kind of profit / loss would the firm make and why? (2 marks)
Step by Step Solution
★★★★★
3.59 Rating (149 Votes )
There are 3 Steps involved in it
Step: 1
1 Curve A is the average cost AC curve Curve B is the marginal cost MC curve and Curve C is the total cost TC curve 2 Line D is the marginal revenue M...
Get Instant Access to Expert-Tailored Solutions
See step-by-step solutions with expert insights and AI powered tools for academic success
Step: 2

Step: 3

Ace Your Homework with AI
Get the answers you need in no time with our AI-driven, step-by-step assistance
Get Started


