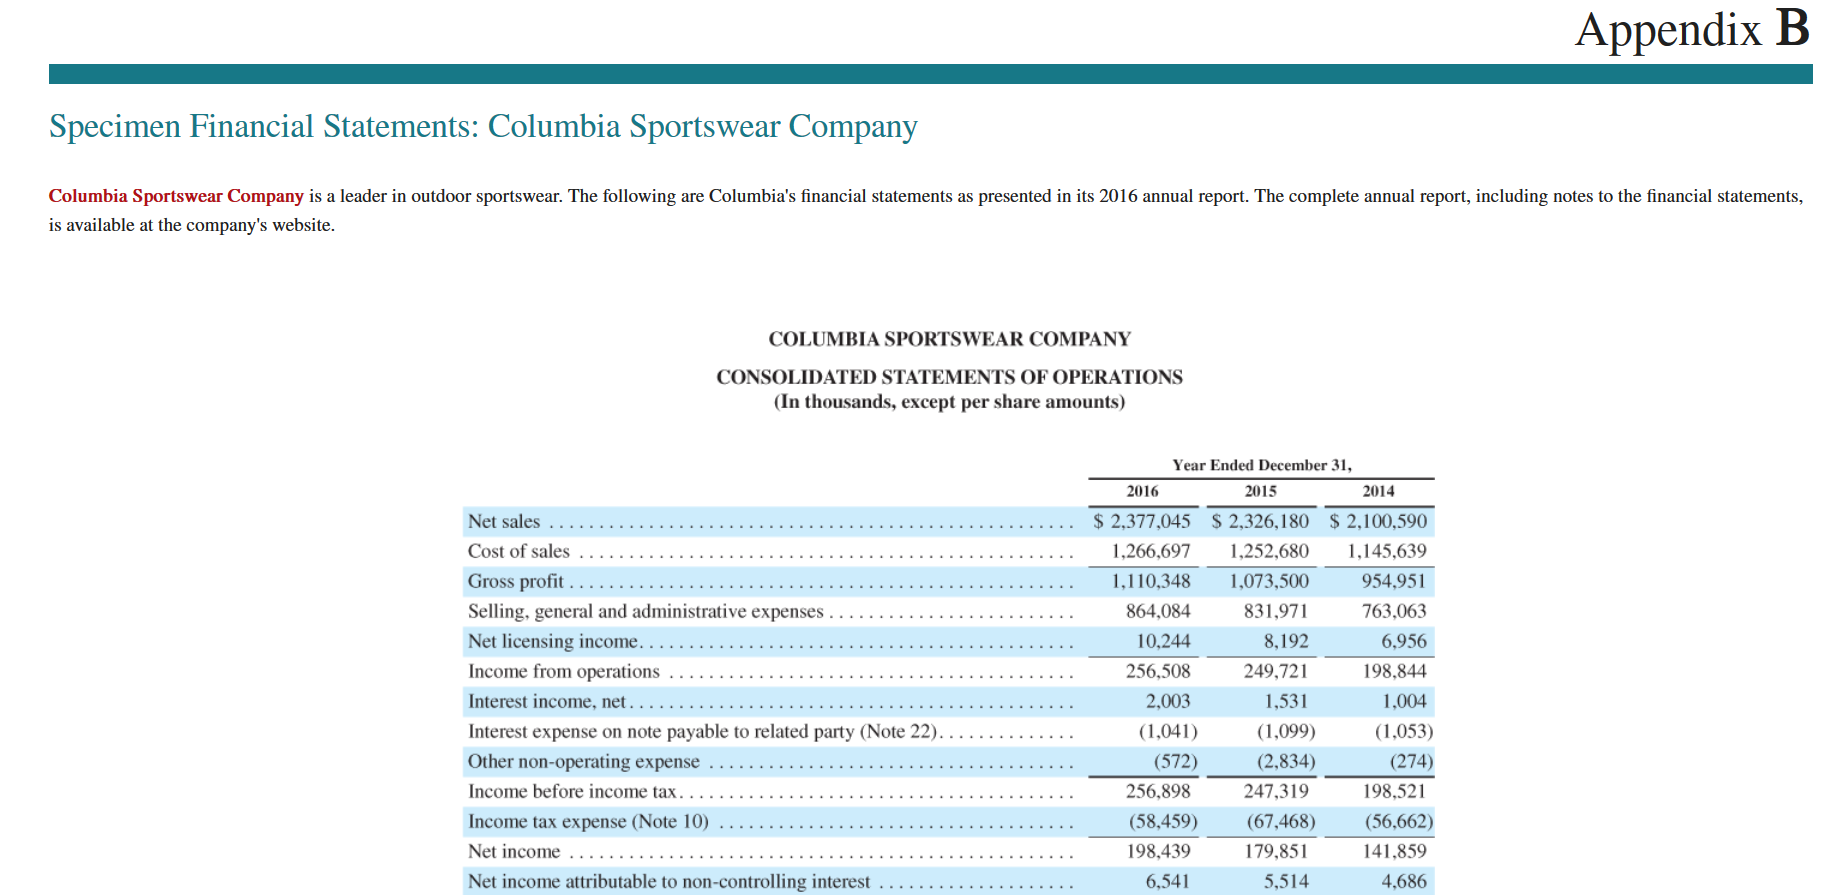
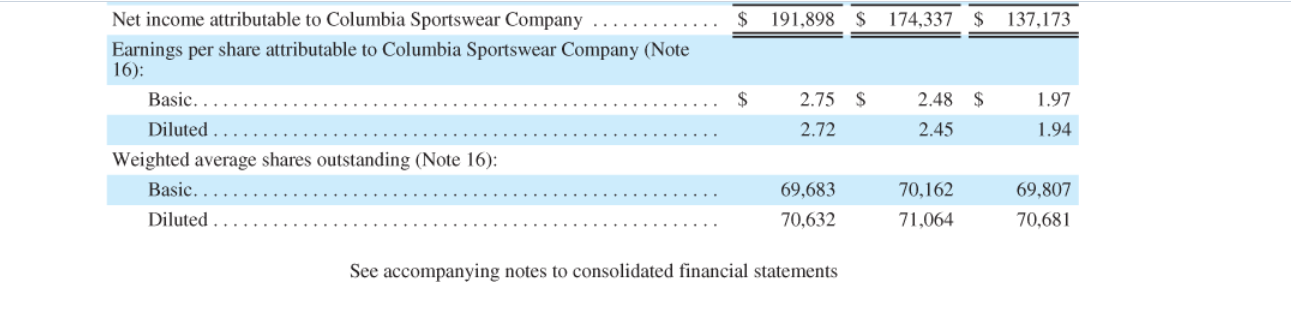
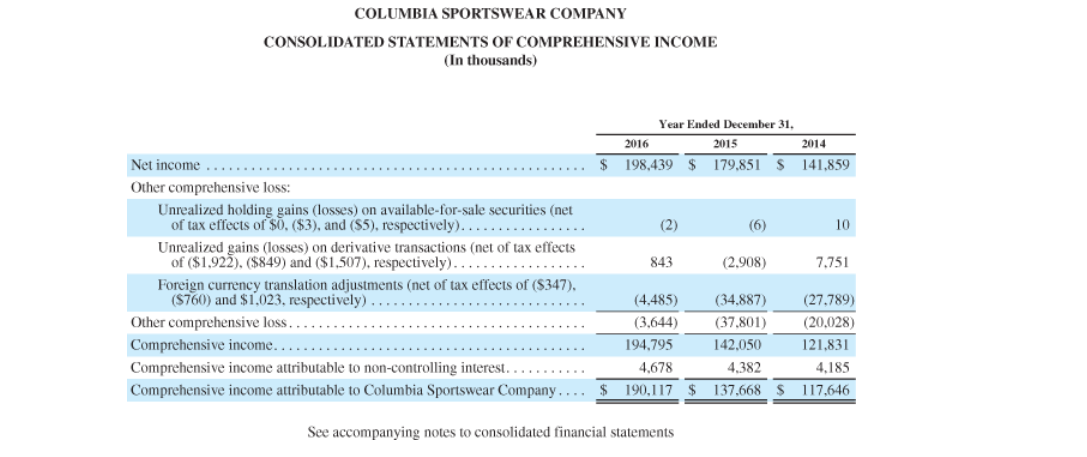
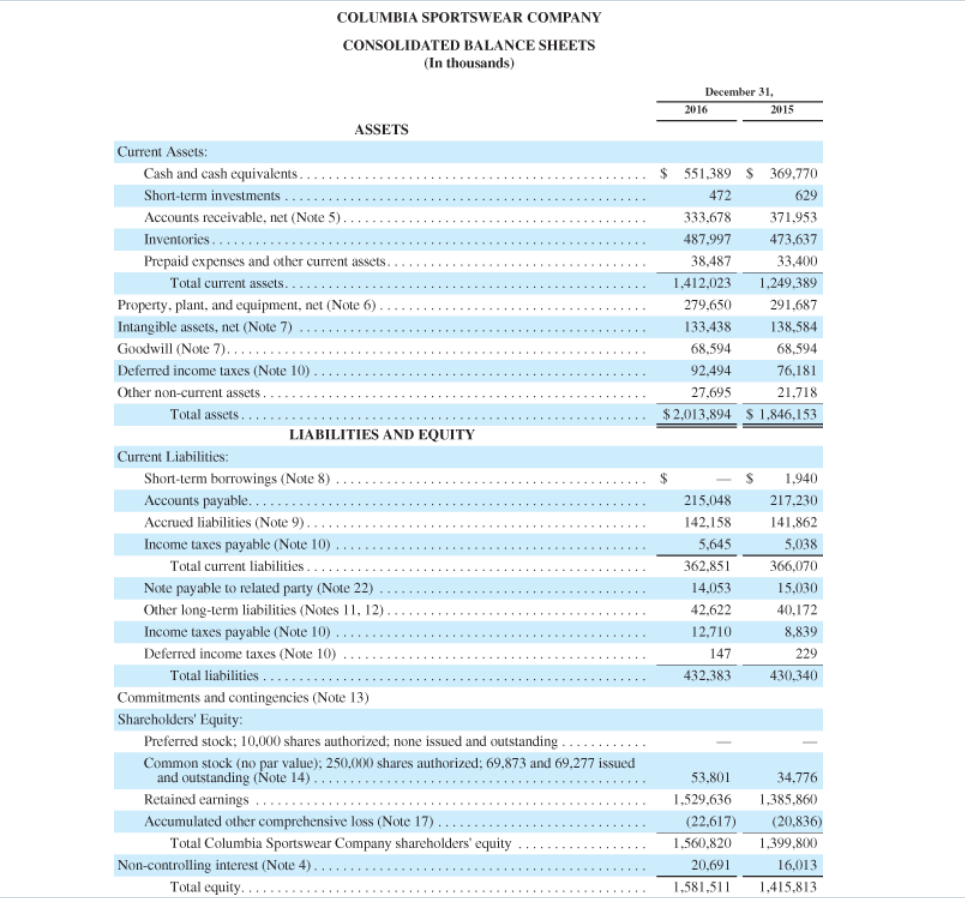
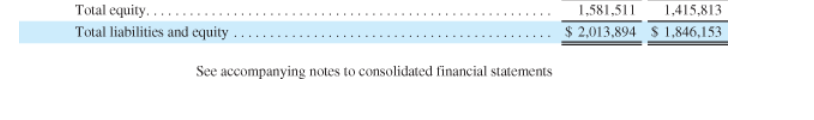
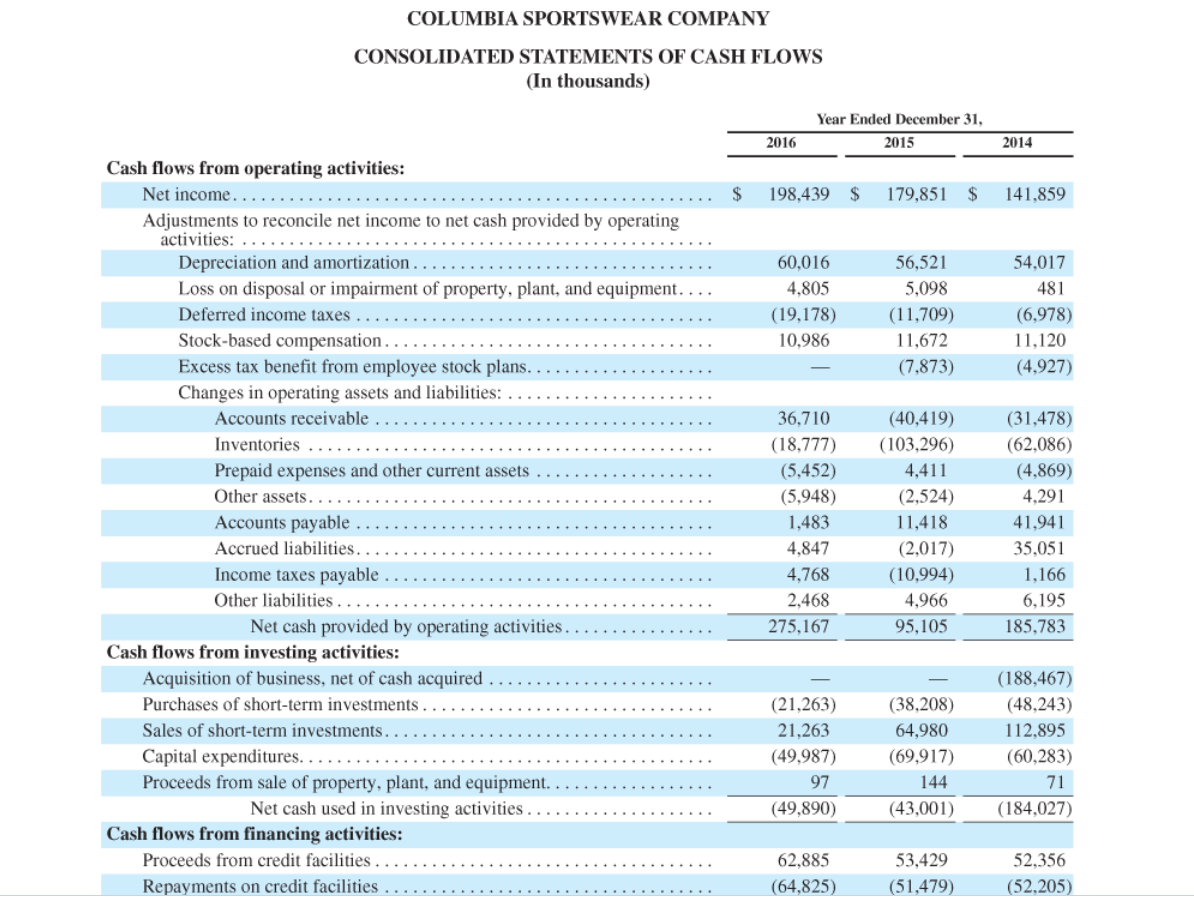
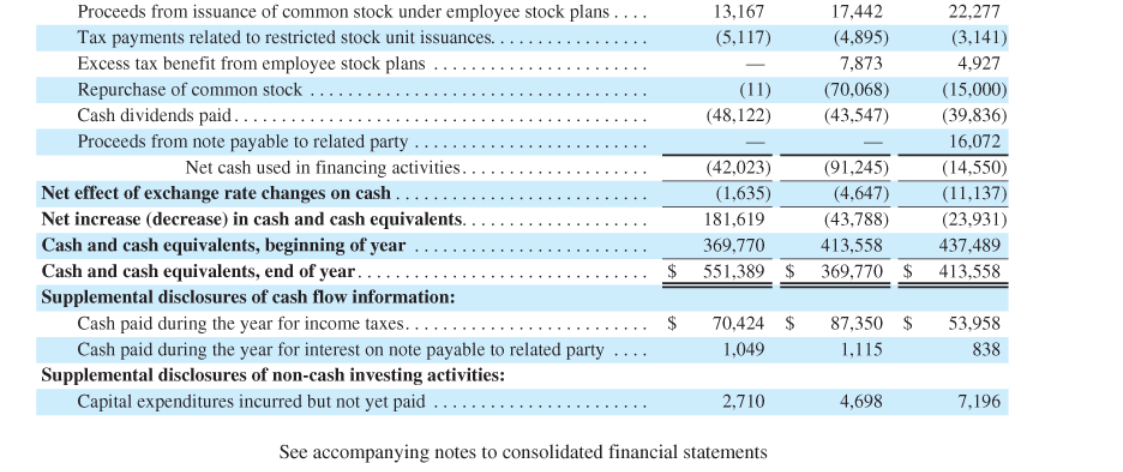
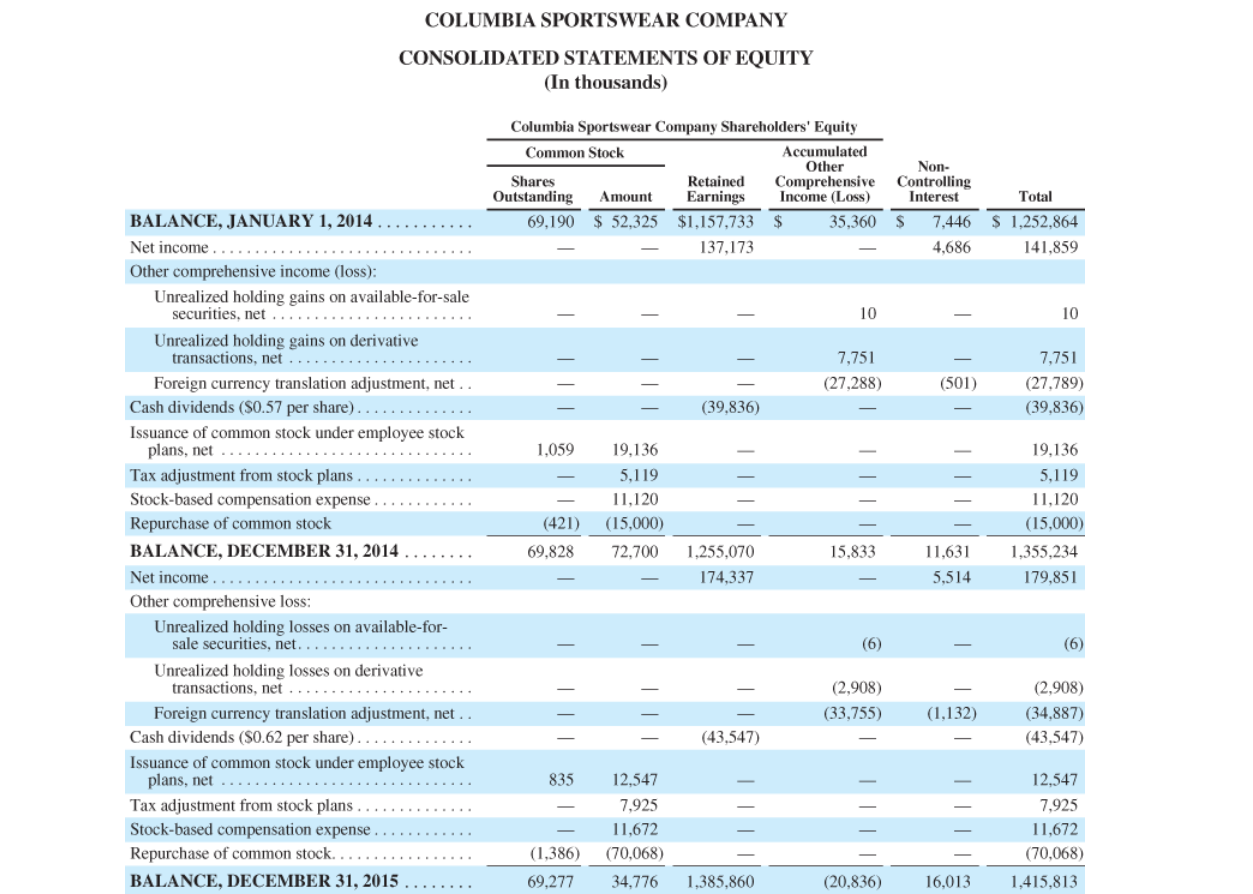
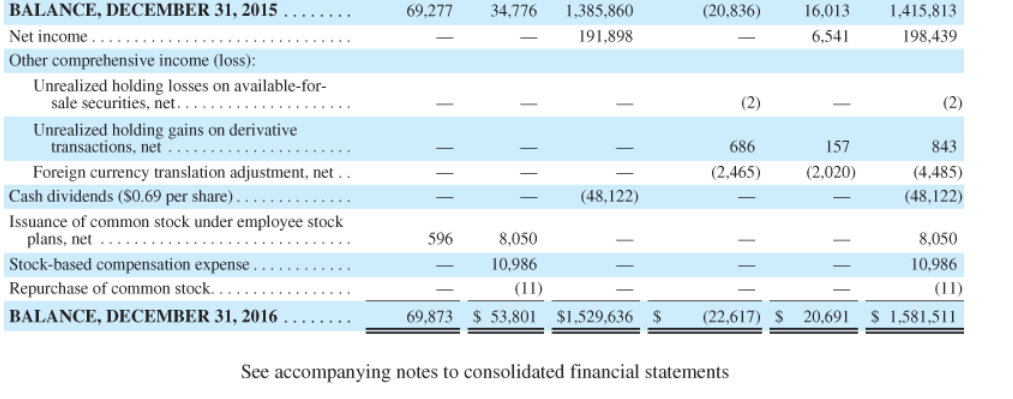
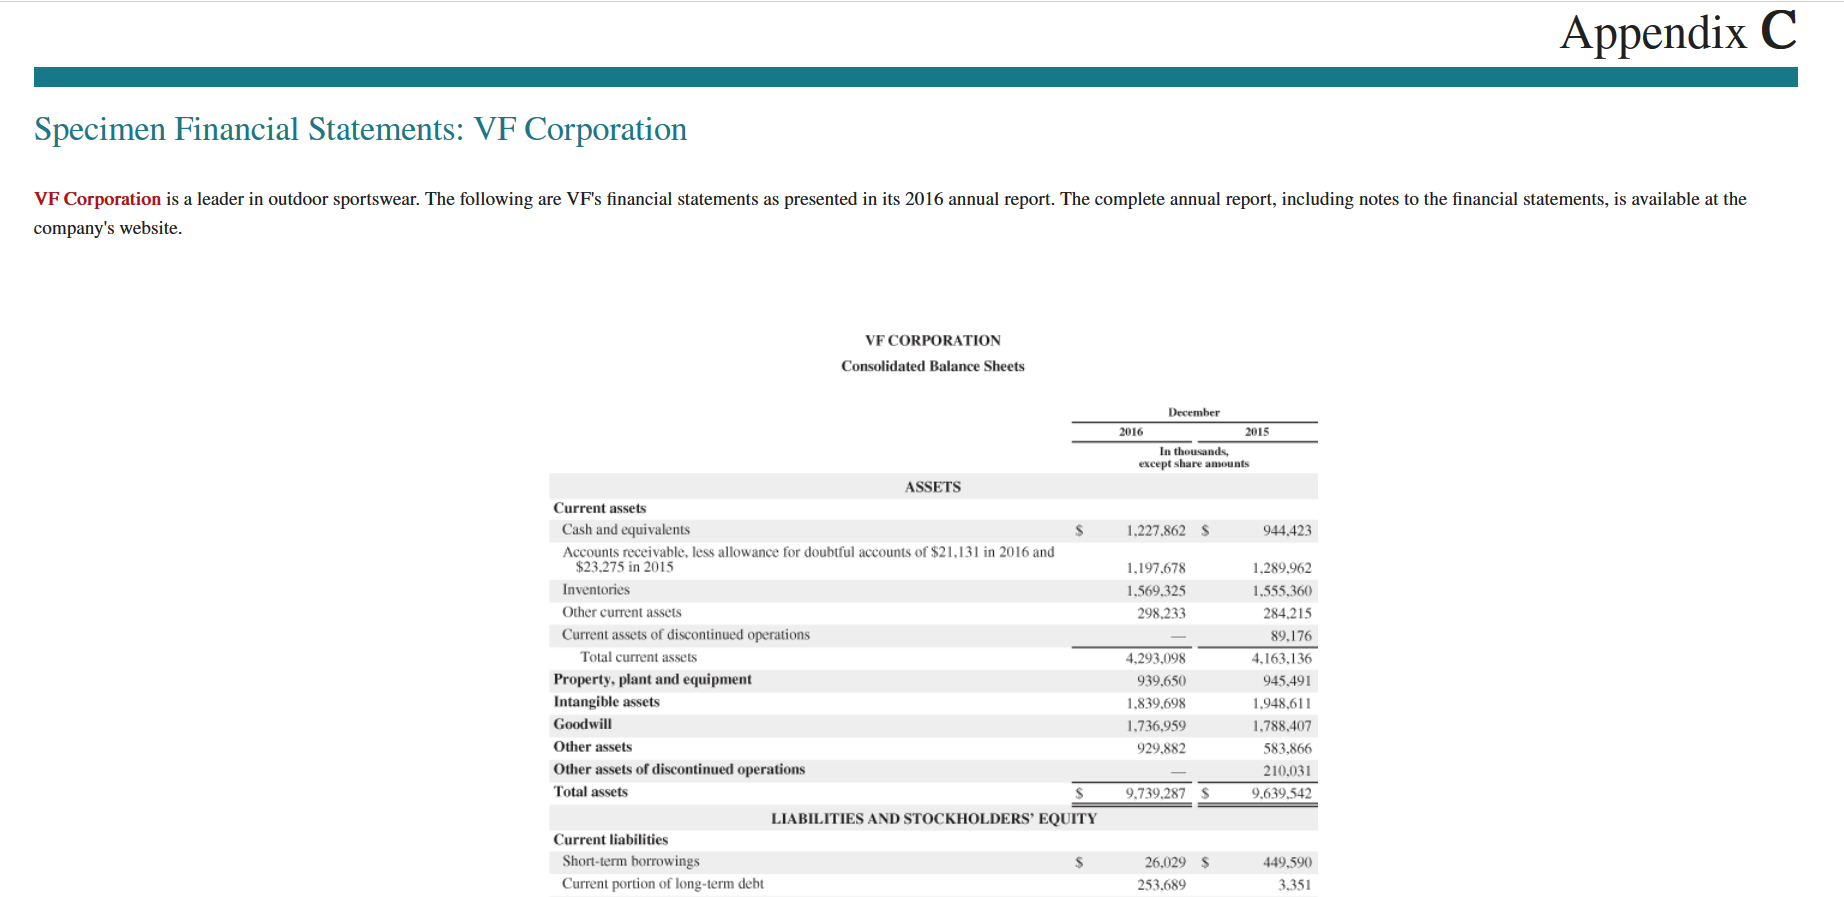
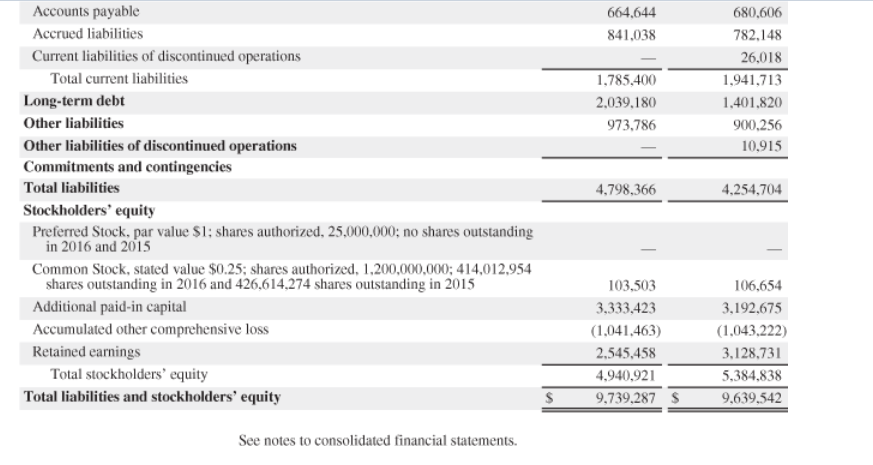
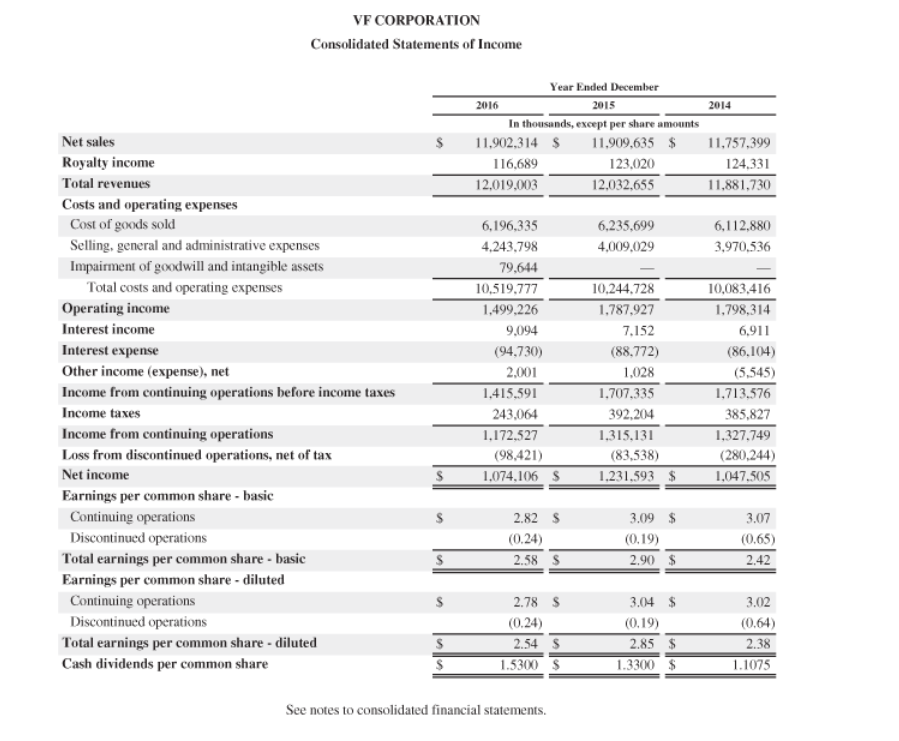
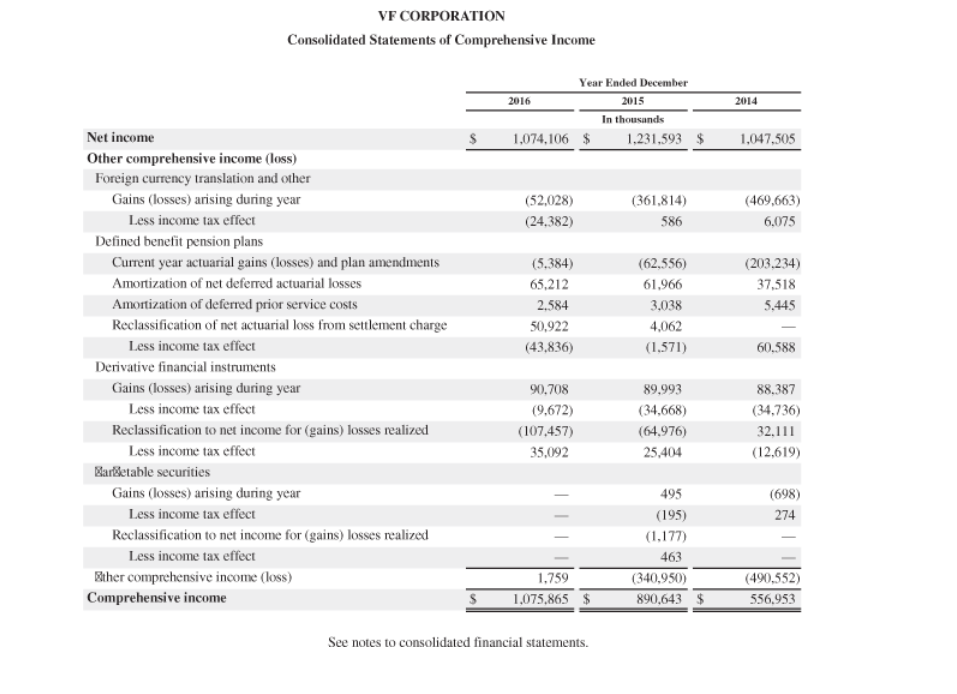
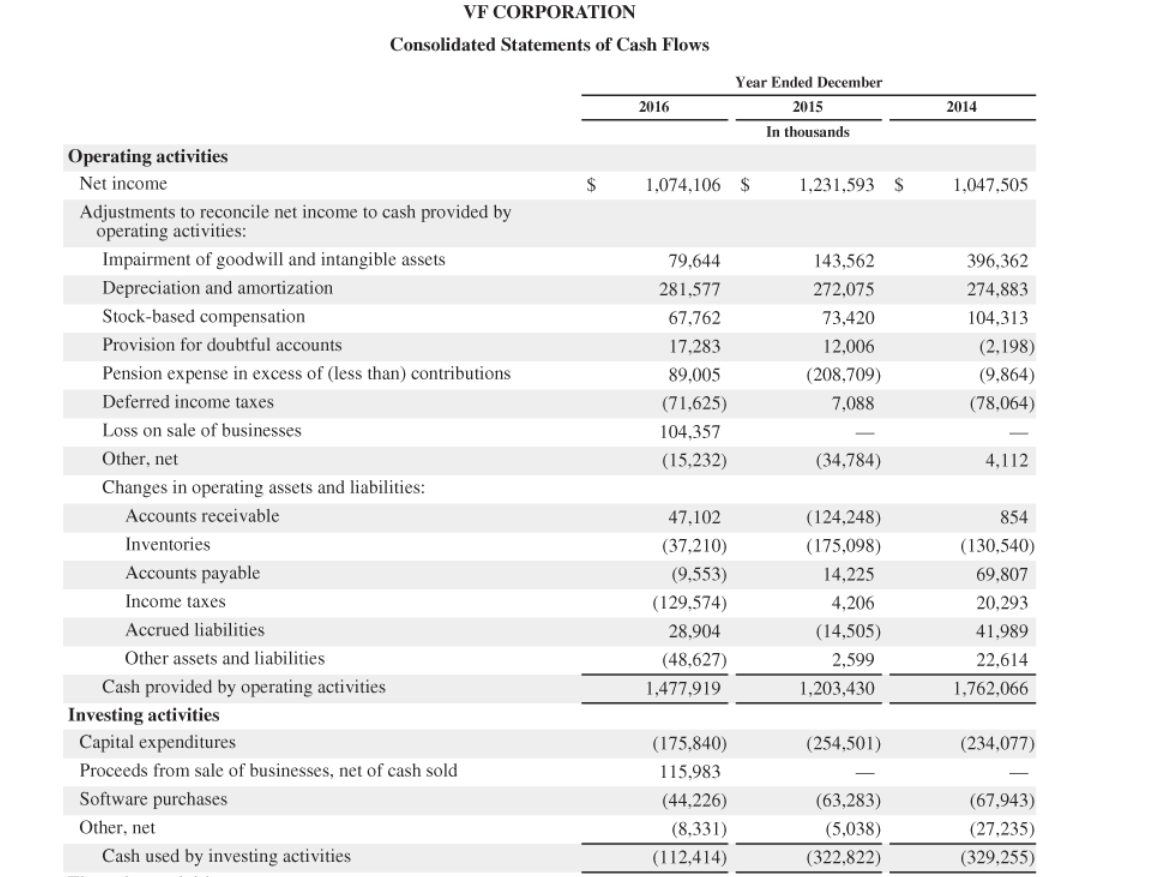
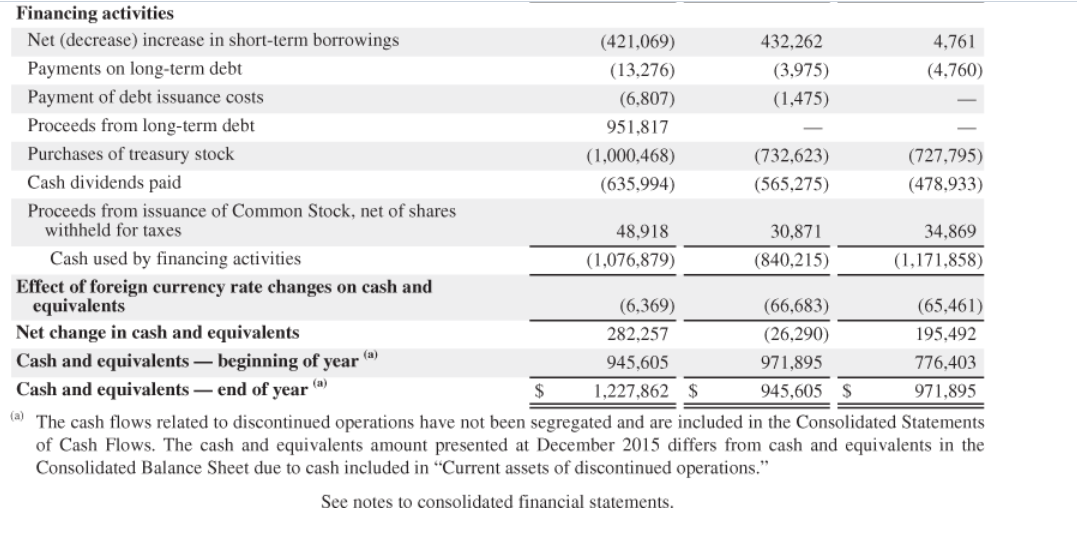
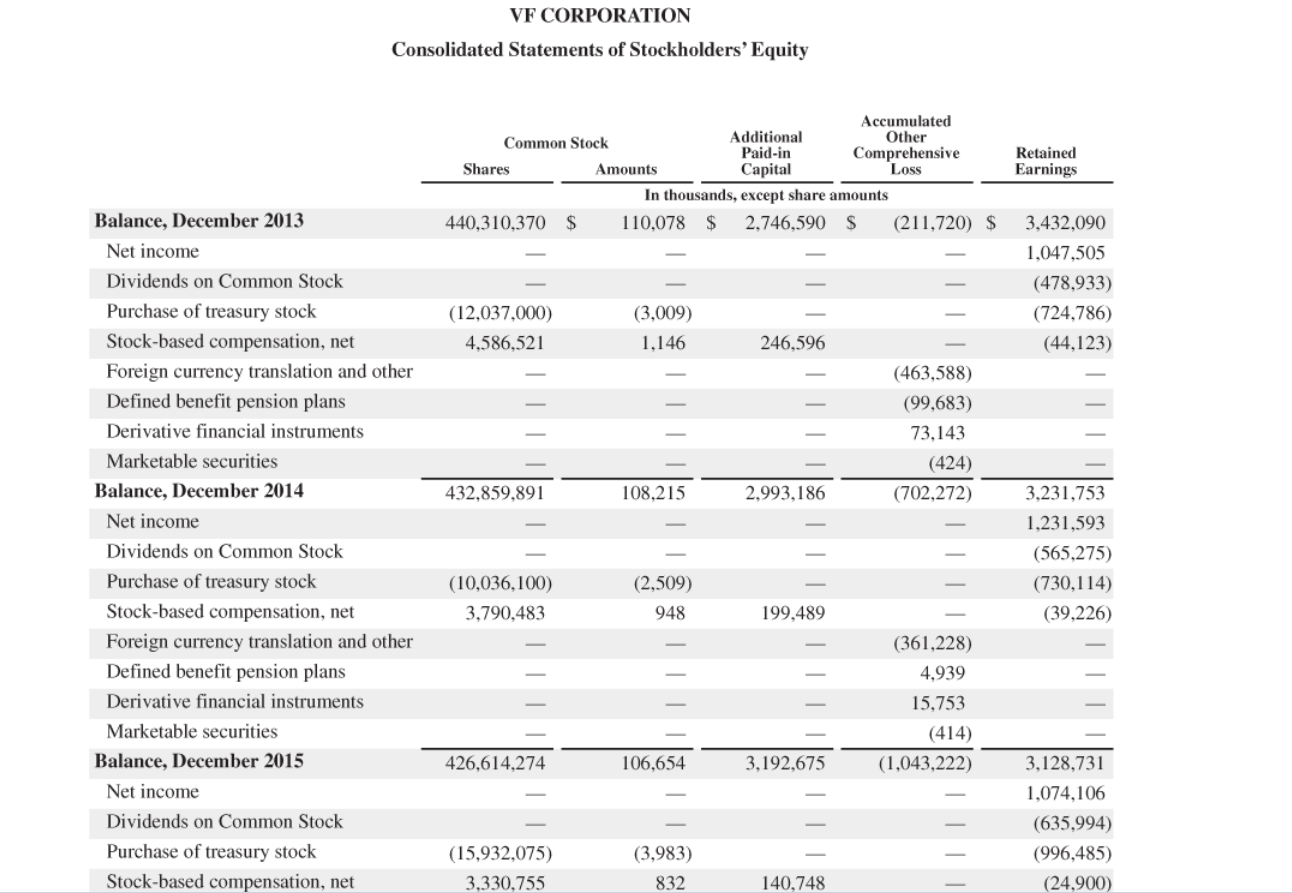
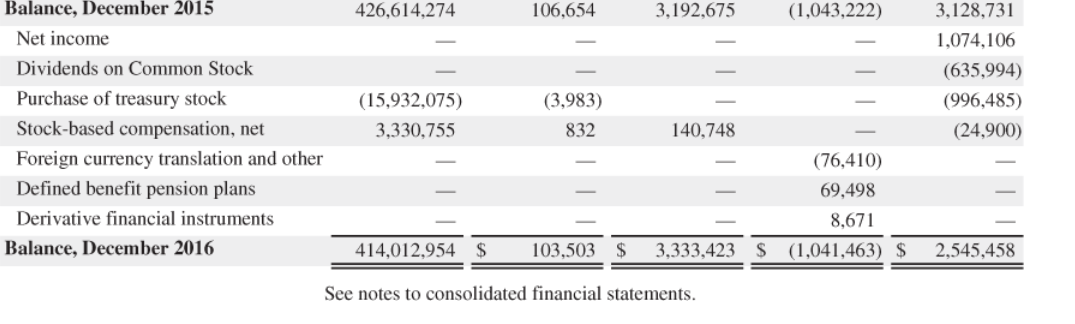
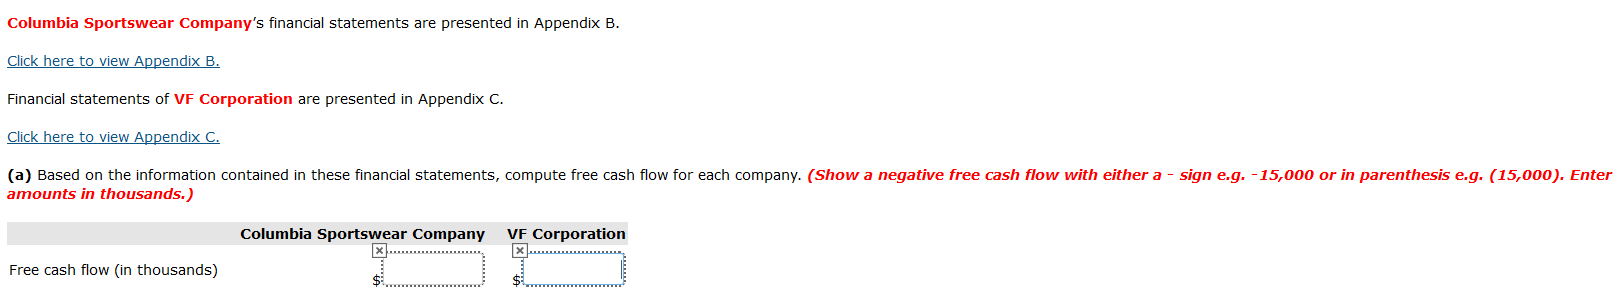
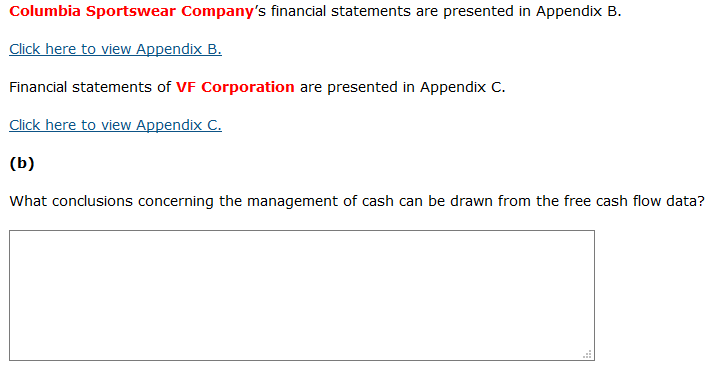
Appendix B Specimen Financial Statements: Columbia Sportswear Company Columbia Sportswear Company is a leader in outdoor sportswear. The following are Columbia's financial statements as presented in its 2016 annual report. The complete annual report, including notes to the financial statements, is available at the company's website. COLUMBIA SPORTSWEAR COMPANY CONSOLIDATED STATEMENTS OF OPERATIONS (In thousands, except per share amounts) Year Ended December 31, 2016 2015 2014 $ 2,377,045 $ 2,326,180 $ 2,100,590 Net sales Cost of sales 1,252,680 1,145,639 1,266,697 Gross profit . 1,073,500 1,110,348 954,951 Selling, general and administrative expenses 763,063 864,084 831,971 8,192 Net licensing income. . 10,244 6,956 Income from operations 256,508 249,721 198,844 Interest income, net . 2,003 1,531 1,004 Interest expense on note payable to related party (Note 22). Other non-operating expense (1,099) (1,053) (1,041) (274) (572) (2,834) Income before income tax. . 247,319 256,898 198,521 Income tax expense (Note 10) (67,468) (56,662) (58,459) Net income 198,439 179,851 141,859 Net income attributable to non-controlling interest 6,541 5,514 4,686 Net income attributable to Columbia Sportswear Company 191,898 174,337 $ 137,173 Earnings per share attributable to Columbia Sportswear Company (Note 16): 2$ Basic. 2.75 $ 2.48 $ 1.97 Diluted . 2.72 2.45 1.94 Weighted average shares outstanding (Note 16): 69,683 70,162 69,807 Basic. 70,632 Diluted 71,064 70,681 See accompanying notes to consolidated financial statements COLUMBIA SPORTSWEAR COMPANY CONSOLIDATED STATEMENTS OF COMPREHENSIVE INCOME (In thousands) Year Ended December 31, 2016 2015 2014 Net income 198,439 $ 141,859 179,851 S Other comprehensive loss: Unrealized holding gains (losses) on available-for-sale securities (net of tax effects of $0, ($3), and ($5), respectively)...... (2) (6) 10 Unrealized gains (losses) on derivative transactions (net of tax effects of ($1,922), ($849) and ($1,507), respectively). ... (2,908) 7,751 843 Foreign currency translation adjustments (net of tax effects of ($347), (S760) and $1,023, respectively)...................... (34,887) (27.789) (4,485) Other comprehensive loss.. Comprehensive income.... (3,644) (37,801) (20,028) 194,795 142,050 121,831 Comprehensive income attributable to non-controlling interest. . 4,678 4.382 4,185 Comprehensive income attributable to Columbia Sportswear Company. ... $ 117,646 190,117 $ 137.668 See accompanying notes to consolidated financial statements Total equity..... 1,581,511 1,415,813 $ 2,013,894 $ 1,846,153 Total liabilities and equity See accompanying notes to consolidated financial statements COLUMBIA SPORTSWEAR COMPANY CONSOLIDATED STATEMENTS OF CASH FLOWS (In thousands) Year Ended December 31, 2016 2015 2014 Cash flows from operating activities: Net income. .. 179,851 $ 198,439 $ 141,859 Adjustments to reconcile net income to net cash provided by operating activities: Depreciation and amortization Loss on disposal or impairment of property, plant, and equipment.... Deferred income taxes . Stock-based compensation.. . Excess tax benefit from employee stock plans. . 60,016 56,521 54,017 5,098 4,805 481 (19,178) (11,709) (6,978) 11,672 11,120 10,986 (7,873) (4,927) Changes in operating assets and liabilities: Accounts receivable 36,710 (40,419) (31,478) Inventories (18,777) (103,296) (62,086) (4,869) Prepaid expenses and other current assets (5,452) 4,411 Other assets. (5,948) (2,524) 4,291 Accounts payable 1,483 11,418 41,941 Accrued liabilities.. 4,847 (2,017) 35,051 Income taxes payable 4,768 (10,994) 1,166 Other liabilities . . 2,468 4,966 6,195 Net cash provided by operating activities. 275,167 95,105 185,783 Cash flows from investing activities: Acquisition of business, net of cash acquired (188,467) Purchases of short-term investments (21,263) (38,208) (48,243) Sales of short-term investments. 64,980 21,263 112,895 (49,987) (69,917) Capital expenditures. . Proceeds from sale of property, plant, and equipment. (60,283) 71 97 144 (43,001) Net cash used in investing activities. (49,890) (184,027) Cash flows from financing activities: Proceeds from credit facilities 62,885 53,429 52,356 Repayments on credit facilities (64,825) (51,479) (52,205) ..... ... Proceeds from issuance of common stock under employee stock plans.... Tax payments related to restricted stock unit issuances. Excess tax benefit from employee stock plans 13,167 17,442 22,277 (4,895) (5,117) (3,141) 7,873 4,927 Repurchase of common stock Cash dividends paid.. Proceeds from note payable to related party . . . (70,068) (11) (15,000) (48,122) (43,547) (39,836) 16,072 Net cash used in financing activities.. (42,023) (91,245) (14,550) Net effect of exchange rate changes on cash . . . Net increase (decrease) in cash and cash equivalents. . Cash and cash equivalents, beginning of year Cash and cash equivalents, end of year. Supplemental disclosures of cash flow information: Cash paid during the year for income taxes. Cash paid during the year for interest on note payable to related party . ... (11,137) (1,635) (4,647) 181,619 (43,788) (23,931) 437,489 369,770 413,558 369,770 $ 2$ 551,389 $ 413,558 70,424 $ 87,350 $ 2$ 53,958 1,049 838 1,115 Supplemental disclosures of non-cash investing activities: Capital expenditures incurred but not yet paid 4,698 2,710 7,196 See accompanying notes to consolidated financial statements COLUMBIA SPORTSWEAR COMPANY CONSOLIDATED STATEMENTS OF EQUITY (In thousands) Columbia Sportswear Company Shareholders' Equity Accumulated Other Comprehensive Controlling Income (Loss) Common Stock Non- Shares Outstanding Retained Earnings Amount Interest Total $ 52,325 $1,157,733 BALANCE, JANUARY 1, 2014 7,446 $ 1,252,864 69,190 2$ 35,360 $ Net income ....... 137,173 4,686 141,859 Other comprehensive income (loss): Unrealized holding gains on available-for-sale securities, net 10 10 Unrealized holding gains on derivative transactions, net ... 7,751 7,751 (27,288) (501) (27,789) Foreign currency translation adjustment, net . . Cash dividends ($0.57 per share).............. (39,836) (39,836) Issuance of common stock under employee stock plans, net Tax adjustment from stock plans . . . . ....... . .. Stock-based compensation expense . . . . Repurchase of common stock 1,059 19,136 19,136 5,119 5,119 11,120 11,120 (15,000) (421) (15,000) BALANCE, DECEMBER 31, 2014 . . . ..... 15,833 69,828 72,700 1,255,070 11,631 1,355,234 Net income 174,337 5,514 179,851 ..... Other comprehensive loss: Unrealized holding losses on available-for- sale securities, net. (6) (6) Unrealized holding losses on derivative transactions, net (2,908) (2,908) (33,755) Foreign currency translation adjustment, net . . (1,132) (34,887) Cash dividends ($0.62 per share) (43,547) (43,547) Issuance of common stock under employee stock plans, net ... Tax adjustment from stock plans ... Stock-based compensation expense...... . .. .. Repurchase of common stock.. 835 12.547 12,547 7,925 7,925 11,672 11,672 (70,068) (70,068) (1,386) BALANCE, DECEMBER 31, 2015 69,277 1,385,860 16.013 34,776 (20,836) 1,415,813 BALANCE, DECEMBER 31, 2015 69,277 1,385,860 (20,836) 16,013 34,776 1,415,813 ..... Net income....... 6,541 191,898 198,439 Other comprehensive income (loss): Unrealized holding losses on available-for- sale securities, net. (2) (2) Unrealized holding gains on derivative transactions, net ..... 157 843 686 (2,465) (2,020) (4,485) Foreign currency translation adjustment, net . . Cash dividends ($0.69 per share)... (48,122) (48,122) Issuance of common stock under employee stock plans, net Stock-based compensation expense . 8,050 596 8,050 10,986 10,986 Repurchase of common stock. (11) (11) $ 1,581,511 BALANCE, DECEMBER 31, 2016 69,873 $ 53,801 $1,529,636 2$ (22,617) $ 20,691 See accompanying notes to consolidated financial statements Appendix C Specimen Financial Statements: VF Corporation VF Corporation is a leader in outdoor sportswear. The following are VF's financial statements as presented in its 2016 annual report. The complete annual report, including notes to the financial statements, is available at the company's website. VF CORPORATION Consolidated Balance Sheets December 2016 2015 In thousands, except share amounts ASSETS Current assets Cash and equivalents 944,423 1,227,862 S Accounts receivable, less allowance for doubtful accounts of $21,131 in 2016 and $23,275 in 2015 1,197,678 1,289,962 Inventories 1,555.360 1.569.325 Other current assets 298,233 284,215 Current assets of discontinued operations 89,176 Total current assets 4,293,098 4,163,136 Property, plant and equipment 939,650 945,491 Intangible assets Goodwill 1,839,698 1,948,611 1,788,407 1,736,959 Other assets 929,882 583,866 Other assets of discontinued operations 210.031 Total assets 9.639,542 9,739,287 LIABILITIES AND STOCKHOLDERS EQUITY Current liabilities Short-term borrowings 26,029 449,590 %24 Current portion of long-term debt 253,689 3,351 Accounts payable 664,644 680,606 Accrued liabilities 841,038 782,148 Current liabilities of discontinued operations 26,018 1,785,400 Total current liabilities 1,941,713 Long-term debt Other liabilities 2,039,180 1,401,820 973,786 900,256 Other liabilities of discontinued operations Commitments and contingencies 10,915 Total liabilities 4,798,366 4,254,704 Stockholders' equity Preferred Stock, par value $1; shares authorized, 25,000,000; no shares outstanding in 2016 and 2015 Common Stock, stated value $0.25; shares authorized, 1,200,000,000; 414,012,954 shares outstanding in 2016 and 426,614,274 shares outstanding in 2015 103,503 106,654 3,333,423 Additional paid-in capital 3,192,675 Accumulated other comprehensive loss (1,041,463) (1,043,222) Retained earnings 2,545,458 3,128,731 5,384,838 9,639,542 4,940,921 Total stockholders' equity Total liabilities and stockholders' equity 9,739,287 $ See notes to consolidated financial statements. VF CORPORATION Consolidated Statements of Income Year Ended December 2016 2015 In thousands, except per share amounts 2014 Net sales 11,902,314 $ 11,909,635 $ 11,757,399 Royalty income 123,020 124,331 116,689 12,019,003 12,032,655 11,881,730 Total revenues Costs and operating expenses Cost of goods sold 6,235,699 6,196,335 6,112,880 Selling, general and administrative expenses 4,243,798 4,009,029 3,970,536 Impairment of goodwill and intangible assets 79,644 10,519,777 1,499,226 10,083,416 Total costs and operating expenses 10,244,728 1,787,927 Operating income 1,798,314 Interest income 9,094 7,152 6,911 Interest expense (94,730) (88,772) (86,104) Other income (expense), net (5,545) 2,001 1,028 1,415,591| 1,707,335 1,713,576 Income from continuing operations before income taxes Income taxes 243,064 392,204 385,827 1,172,527 1,315,131 1,327,749 Income from continuing operations Loss from discontinued operations, net of tax (98,421) (83,538) (280,244) 1,074.106 S Net income 1,231,593 $ 1,047,505 Earnings per common share - basic Continuing operations Discontinued operations Total earnings per common share - basic 3.09 $ 3.07 2.82 S (0.24) (0.65) (0.19) 2.42 2.90 $ 2.58 S Earnings per common share - diluted Continuing operations Discontinued operations 2.78 S 3.04 $ 3.02 (0.24) (0.64) (0.19) 2.38 1.1075 Total earnings per common share - diluted 2.85 2.54 1.5300 S Cash dividends per common share 1.3300 $ See notes to consolidated financial statements. VF CORPORATION Consolidated Statements of Comprehensive Income Year Ended December 2016 2014 2015 In thousands 1,231,593 $ Net income 1,074,106 $ 1,047,505 Other comprehensive income (loss) Foreign currency translation and other Gains (losses) arising during year (52,028) (361,814) (469,663) Less income tax effect 6,075 (24,382) 586 Defined benefit pension plans Current year actuarial gains (losses) and plan amendments (5,384) (62,556) (203,234) Amortization of net deferred actuarial losses 37,518 65,212 61,966 Amortization of deferred prior service costs 2,584 3,038 5,445 Reclassification of net actuarial loss from settlement charge 50,922 4,062 Less income tax effect 60,588 (43,836) (1,571) Derivative financial instruments Gains (losses) arising during year 90,708 89,993 88,387 Less income tax effect (9,672) (34,668) (34,736) Reclassification to net income for (gains) losses realized (107,457) 32,111 (64,976) Less income tax effect (12,619) 35,092 25,404 Marletable securities Gains (losses) arising during year 495 (698) Less income tax effect (195) 274 Reclassification to net income for (gains) losses realized (1,177) Less income tax effect 463 (490,552) 556,953 Ether comprehensive income (loss) Comprehensive income (340,950) 1,759 1,075,865 $ 890,643 $ See notes to consolidated financial statements. VF CORPORATION Consolidated Statements of Cash Flows Year Ended December 2016 2015 2014 In thousands Operating activities Net income 2$ 1,074,106 $ 1,047,505 1,231,593 $ Adjustments to reconcile net income to cash provided by operating activities: Impairment of goodwill and intangible assets 396,362 79,644 143,562 Depreciation and amortization 281,577 272,075 274,883 Stock-based compensation 67,762 73,420 104,313 Provision for doubtful accounts 17,283 12,006 (2,198) Pension expense in excess of (less than) contributions (9,864) 89,005 (208,709) Deferred income taxes (71,625) (78,064) 7,088 Loss on sale of businesses 104,357 Other, net (34,784) (15,232) 4,112 Changes in operating assets and liabilities: Accounts receivable 854 47,102 (124,248) Inventories (175,098) (130,540) (37,210) Accounts payable (9,553) 14,225 69,807 Income taxes (129,574) 20,293 4,206 Accrued liabilities (14,505) 28,904 41,989 Other assets and liabilities (48,627) 2,599 22,614 Cash provided by operating activities 1,203,430 1,762,066 1,477,919 Investing activities Capital expenditures (254,501) (234,077) (175,840) Proceeds from sale of businesses, net of cash sold 115,983 Software purchases (67,943) (44,226) (63,283) Other, net (8,331) (5,038) (27,235) Cash used by investing activities (112,414) (322,822) (329,255) Financing activities Net (decrease) increase in short-term borrowings (421,069) 432,262 4,761 Payments on long-term debt (3,975) (13,276) (4,760) Payment of debt issuance costs (6,807) (1,475) Proceeds from long-term debt 951,817 Purchases of treasury stock (727,795) (1,000,468) (732,623) Cash dividends paid (635,994) (565,275) (478,933) Proceeds from issuance of Common Stock, net of shares withheld for taxes 30,871 34,869 48,918 Cash used by financing activities (1,076,879) (840,215) (1,171,858) Effect of foreign currency rate changes on cash and equivalents Net change in cash and equivalents Cash and equivalents beginning of year Cash and equivalents end of year @ (6,369) (65,461) (66,683) 282,257 (26,290) 195,492 (a) 945,605 971,895 776,403 945,605 $ 1,227,862 $ 971,895 (a) The cash flows related to discontinued operations have not been segregated and are included in the Consolidated Statements of Cash Flows. The cash and equivalents amount presented at December 2015 differs from cash and equivalents in the Consolidated Balance Sheet due to cash included in "Current assets of discontinued operations." See notes to consolidated financial statements. VF CORPORATION Consolidated Statements of Stockholders Equity Accumulated Other Comprehensive Loss Additional Paid-in Capital Common Stock Retained Earnings Shares Amounts In thousands, except share amounts Balance, December 2013 110,078 $ 3,432,090 440,310,370 $ 2,746,590 $ (211,720) $ Net income 1,047,505 Dividends on Common Stock (478,933) Purchase of treasury stock (3,009) (724,786) (12,037,000) Stock-based compensation, net 246,596 (44,123) 4,586,521 1,146 Foreign currency translation and other Defined benefit pension plans (463,588) (99,683) Derivative financial instruments 73,143 Marketable securities (424) Balance, December 2014 432,859,891 2,993,186 3,231,753 108,215 (702,272) Net income 1,231,593 Dividends on Common Stock (565,275) Purchase of treasury stock (10,036,100) (2,509) (730,114) Stock-based compensation, net 199,489 (39,226) 3,790,483 948 Foreign currency translation and other Defined benefit pension plans (361,228) 4,939 Derivative financial instruments 15,753 Marketable securities (414) Balance, December 2015 426,614,274 3,128,731 106,654 3,192,675 (1,043,222) Net income 1,074,106 Dividends on Common Stock (635,994) Purchase of treasury stock (15,932,075) (3,983) (996,485) Stock-based compensation, net 3,330,755 832 140,748 (24,900) Balance, December 2015 426,614,274 3,128,731 106,654 3,192,675 (1,043,222) Net income 1,074,106 Dividends on Common Stock (635,994) Purchase of treasury stock (15,932,075) (3,983) (996,485) Stock-based compensation, net (24,900) 3,330,755 832 140,748 Foreign currency translation and other Defined benefit pension plans (76,410) 69,498 Derivative financial instruments 8,671 Balance, December 2016 103,503 $ 2,545,458 414,012,954 $ 3,333,423 $ (1,041,463) $ See notes to consolidated financial statements. Columbia Sportswear Company's financial statements are presented in Appendix B. Click here to view Appendix B. Financial statements of VF Corporation are presented in Appendix C. Click here to view Appendix C. (a) Based on the information contained in these financial statements, compute free cash flow for each company. (Sshow a negative free cash flow with either a - sign e.g. -15,000 or in parenthesis e.g. (15,000). Enter amounts in thousands.) VF Corporation Columbia Sportswear Company Free cash flow (in thousands) Columbia Sportswear Company's financial statements are presented in Appendix B. Click here to view Appendix B. Financial statements of VF Corporation are presented in Appendix C. Click here to view Appendix C. (b) What conclusions concerning the management of cash can be drawn from the free cash flow data