Answered step by step
Verified Expert Solution
Question
1 Approved Answer
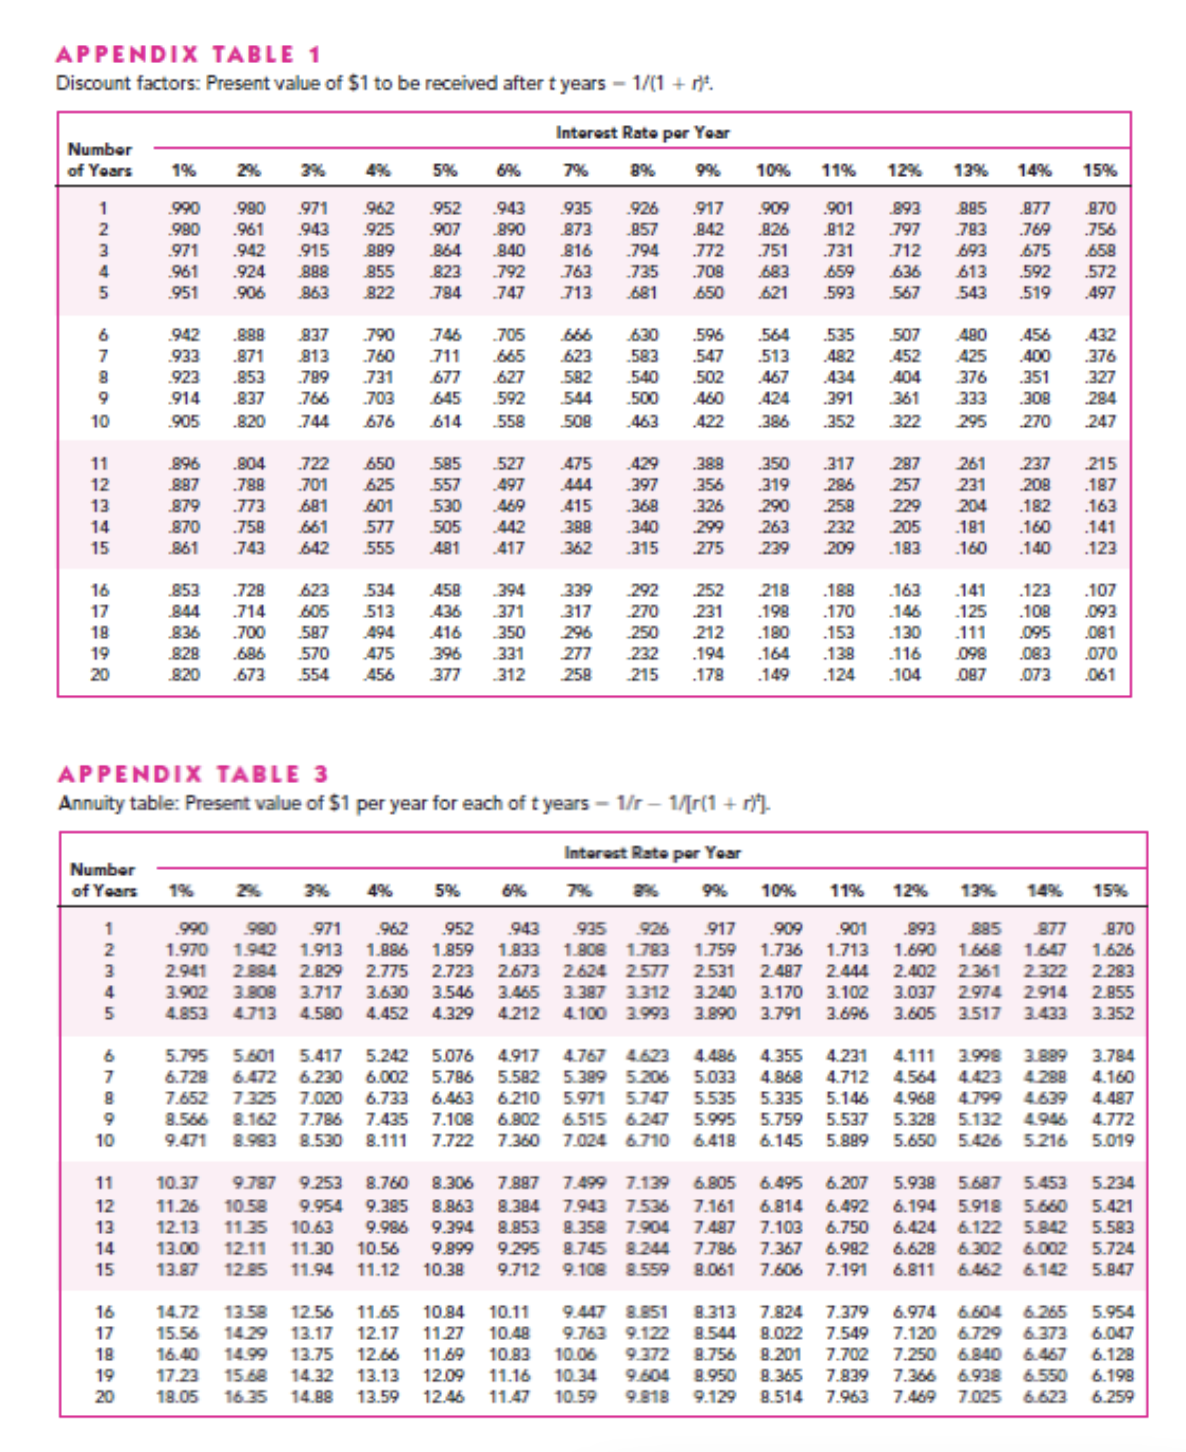
APPENDIX TABLE 1 Discount factors: Present value of $1 to be received after t years - 1/(1+r). Number of Years 1 -2345 6789 10


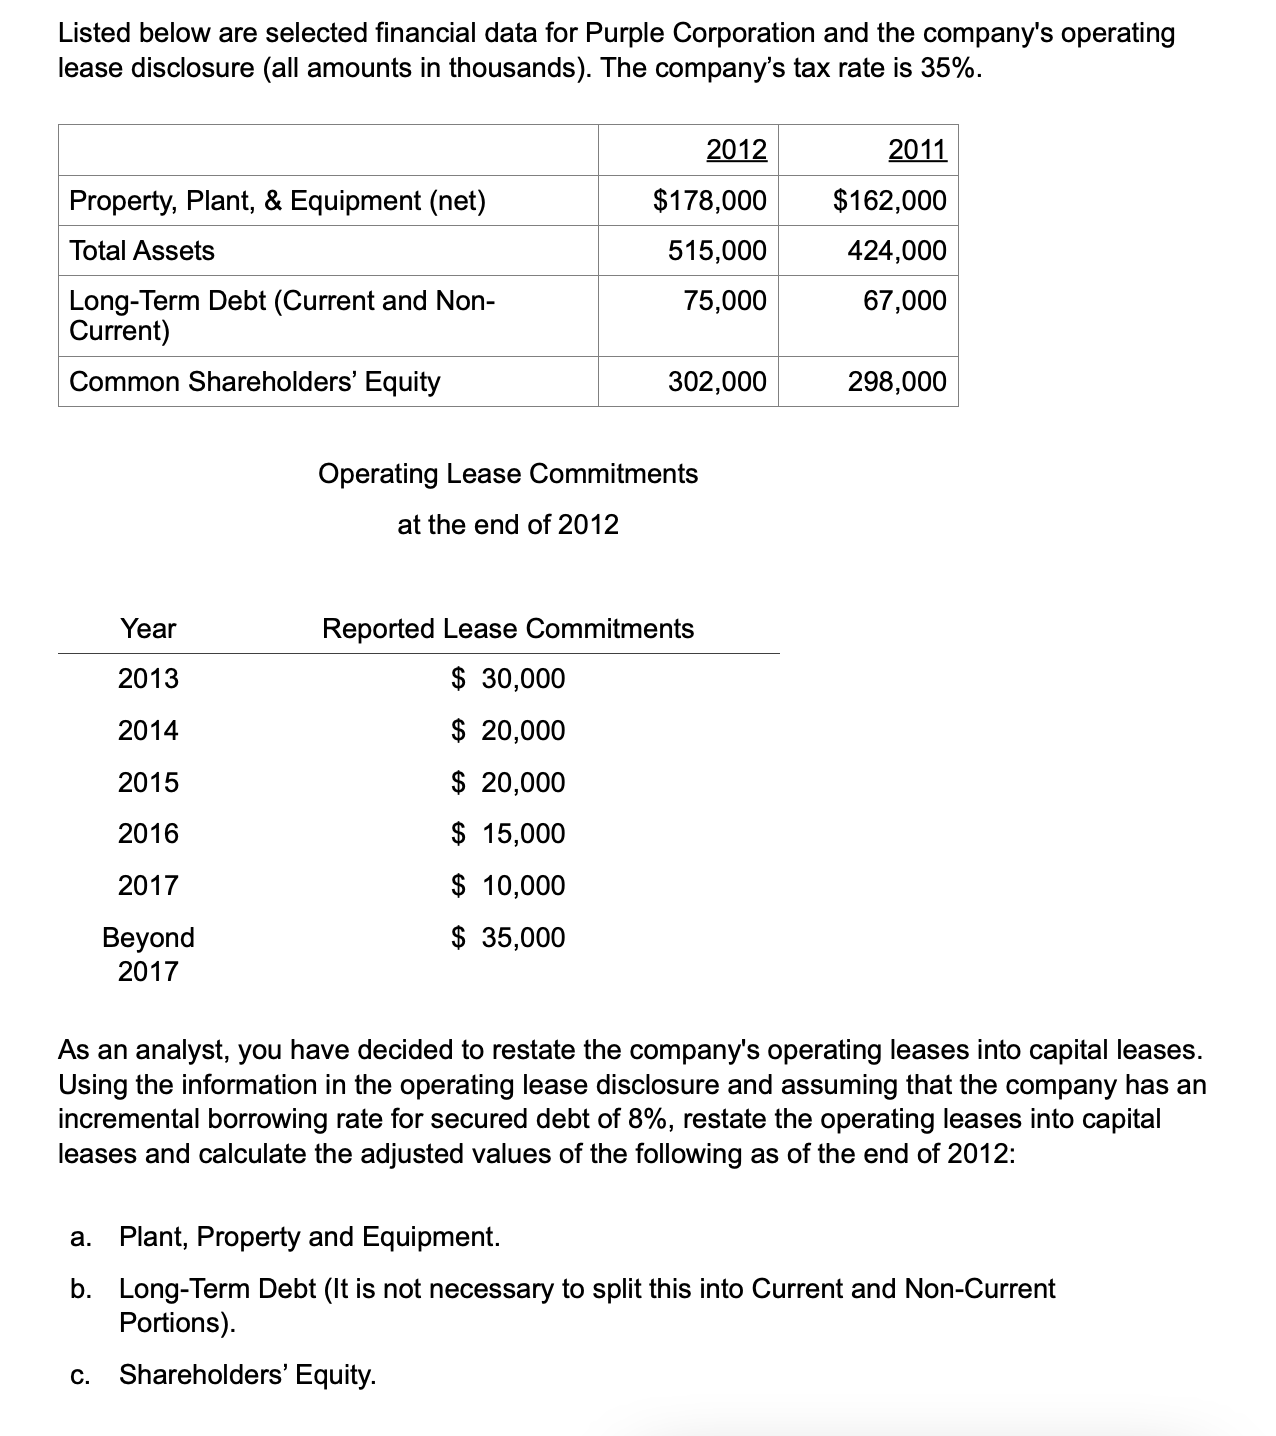
APPENDIX TABLE 1 Discount factors: Present value of $1 to be received after t years - 1/(1+r). Number of Years 1 -2345 6789 10 11 12 13 14 15 16 17 18 19 20 1 2 3 4 5 67890 10 11 12 13 14 15 1% 3% 990 .990 971 962 980 .961 943 925 971 .942 915 889 864 961 .924 888 855 823 792 951 .906 863 822 784 747 Number of Years 1% 16 17 18 19 20 942 .888 933 .871 923 .853 914 .837 905 .820 2% 853 844 Interest Rate per Year 7% 10% 11% 12% 13% 14% 15% 952 943 935 926 917 .658 .909 .901 893 885 877 .870 907 .890 873 .857 .842 .826 .812 797 783 769 .756 840 816 794 .772 .751 .731 712 693 675 763 735 .708 683 .659 636 613 592 713 681 650 621 .593 567 543 519 572 497 896 .804 722 650 585 527 625 557 497 887 788 701 879 .773 681 601 530 469 870 577 505 442 .758 661 642 861 .743 555 481 417 .728 623 534 458 .714 605 513 836 .700 587 494 416 828 .686 570 475 820 .673 554 5% 837 790 746 705 666 813 760 711 665 623 789 731 677 627 582 766 703 645 592 544 744 676 614 558 508 990 980 971 1.970 1.942 1.913 2.941 2.884 2.829 3.902 3.808 4.853 4.713 4% 6% APPENDIX TABLE 3 Annuity table: Present value of $1 per year for each of t years - 1/r - 1/[r(1 + r)). 5% 952 962 1.886 1.859 2.775 2.723 3.717 3.630 3.546 4.580 4.452 4.329 8% 475 429 444 397 415 368 388 340 362 315 394 339 292 252 436 371 317 270 231 .198 350 296 250 212 .180 396 331 277 232 .194 .164 456 377 312 258 215 .178 149 6% 9% 630 596 564 583 .547 .513 535 507 482 452 540 502 467 434 404 500 460 424 .391 361 463 422 386 352 322 388 350 317 356 319 .326 290 7% 299 263 232 275 239 209 Interest Rate per Year 287 257 286 258 229 205 .183 218 .188 480 456 432 425 400 376 .351 333 .308 295 270 9% 10% 12% 13% 11% 943 935 926 917 909 .901 .893 885 877 1.833 1.808 1.783 1.759 1.736 1.713 1.690 1.668 1.647 2.673 2.624 2.577 2.531 2.487 2.444 2.402 2.361 2.322 3.465 3.387 3.312 3.240 3.170 3.102 3.037 2.974 2.914 4.212 4.100 3.993 3.890 3.791 3.696 3.605 3.517 3.433 .376 327 284 247 261 237 215 231 .187 208 204 .182 .163 181 .160 .141 160 .140 .123 141 .123 .107 163 .170 .146 125 .108 .093 130 .153 .138 111 .095 .081 116 098 083 070 104 087 .073 .061 .124 14% 15% 870 1.626 2.283 2.855 3.352 5.417 4.486 5.033 6.230 5.795 5.601 5.242 5.076 4.917 4.767 4.623 4.355 4.231 4.111 3.998 3.889 3.784 6.729 6.472 6.002 5.786 5.582 5.389 5.206 4.868 4.712 4.564 4.423 4.288 4.160 7.652 7.325 7.020 6.733 6.463 6.210 5.971 5.747 5.535 5.335 5.146 4.968 4.799 4.639 4.487 8.566 8.162 7.786 7.435 7.108 6.802 6.515 6.247 5.995 5.759 5.537 5.328 5.132 4.946 4.772 9.471 8.983 8.530 8.111 7.722 7.360 7.024 6.710 6.418 6.145 5.889 5.650 5.426 5.216 5.019 10.37 9.787 9.253 11.26 10.58 9.954 12.13 11.35 10.63 8.760 8.306 7.887 7.499 7.139 6.805 6.495 6.207 5.938 5.687 5.453 5.234 9.385 8.863 8.384 7.943 7.536 7.161 6.814 6.492 6.194 5.918 5.660 5.421 9.986 9.394 8.853 8.358 7.904 7.487 7.103 6.750 6.424 6.122 5.842 5.583 13.00 12.11 11.30 10.56 9.899 9.295 8.745 8.244 7.786 7.367 6.982 6.628 6.302 6.002 5.724 11.94 11.12 10.38 9.712 9.108 8.559 8.061 7.606 7.191 6.811 6.462 6.142 5.847 13.87 12.85 5.954 14.72 13.58 12.56 11.65 10.84 10.11 15.56 14.29 13.17 12.17 11.27 10.48 16.40 14.99 13.75 12.66 11.69 10.83 17.23 15.68 14.32 13.13 12.09 11.16 6.047 9.447 8.851 8.313 7.824 7.379 6.974 6.604 6.265 9.763 9.122 8.544 8.022 7.549 7.120 6.729 6.373 10.06 9.372 8.756 8.201 7.702 7.250 6.840 6.467 6.128 10.34 9.604 8.950 8.365 7.839 7.366 6.938 6.550 6.198 18.05 16.35 14.88 13.59 12.46 11.47 10.59 9.818 9.129 8.514 7.963 7.469 7.025 6.623 6.259 Listed below are selected financial data for Purple Corporation and the company's operating lease disclosure (all amounts in thousands). The company's tax rate is 35%. Property, Plant, & Equipment (net) Total Assets Long-Term Debt (Current and Non- Current) Common Shareholders' Equity Year 2013 2014 2015 2016 2017 Beyond 2017 2012 $178,000 515,000 75,000 302,000 Operating Lease Commitments at the end of 2012 Reported Lease Commitments $ 30,000 $ 20,000 $ 20,000 $ 15,000 $ 10,000 $ 35,000 2011 $162,000 424,000 67,000 298,000 As an analyst, you have decided to restate the company's operating leases into capital leases. Using the information in the operating lease disclosure and assuming that the company has an incremental borrowing rate for secured debt of 8%, restate the operating leases into capital leases and calculate the adjusted values of the following as of the end of 2012: a. Plant, Property and Equipment. b. Long-Term Debt (It is not necessary to split this into Current and Non-Current Portions). c. Shareholders' Equity.
Step by Step Solution
There are 3 Steps involved in it
Step: 1

Get Instant Access to Expert-Tailored Solutions
See step-by-step solutions with expert insights and AI powered tools for academic success
Step: 2

Step: 3

Ace Your Homework with AI
Get the answers you need in no time with our AI-driven, step-by-step assistance
Get Started


