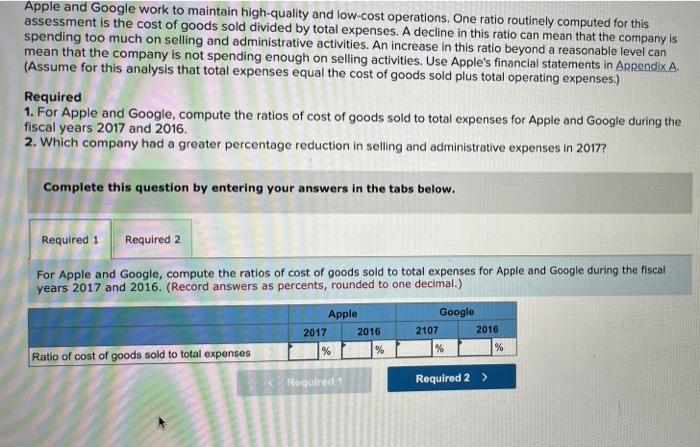
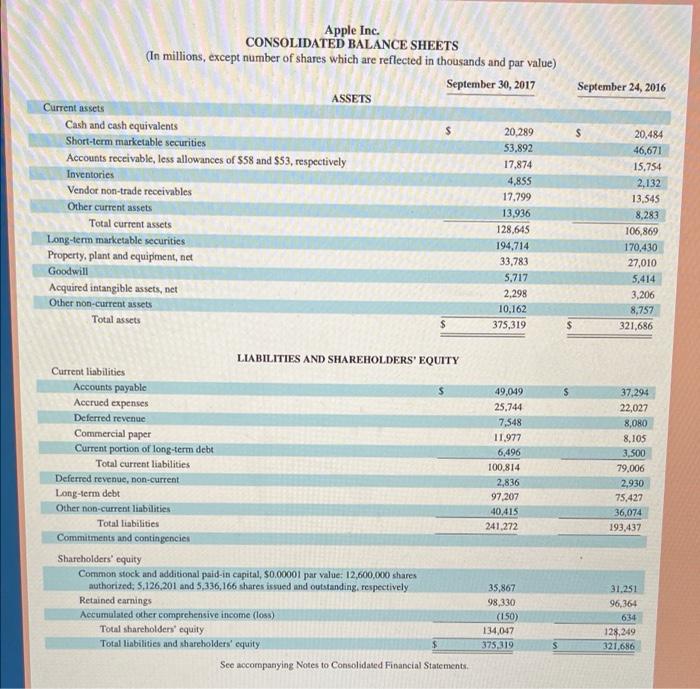
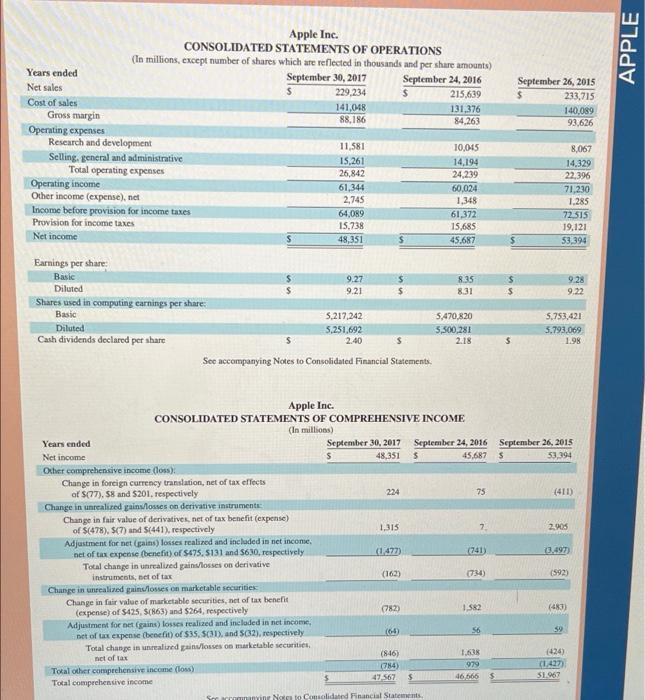
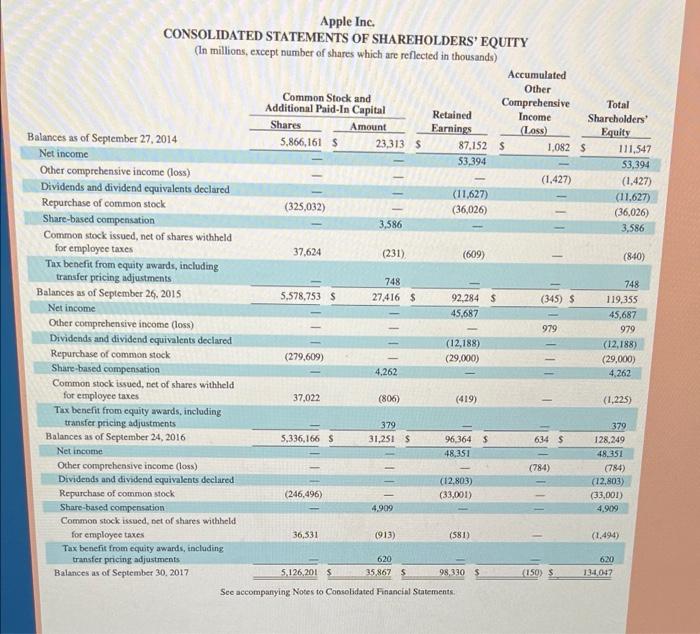
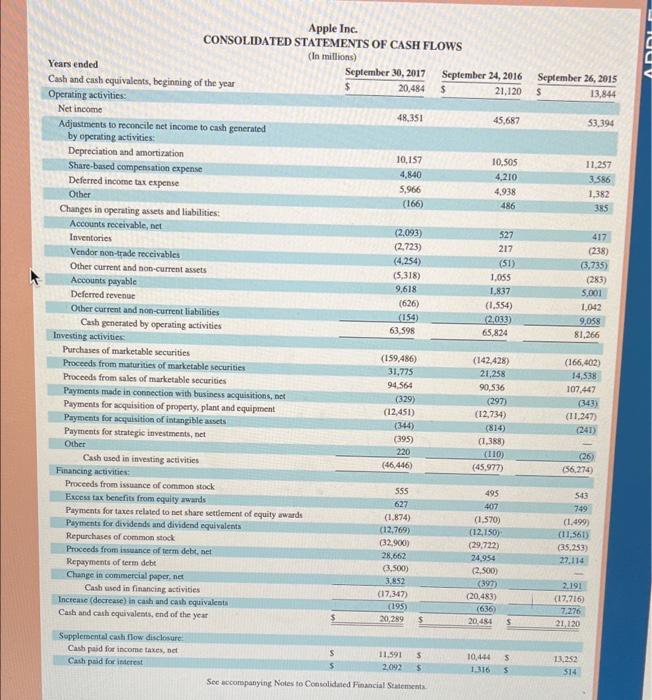
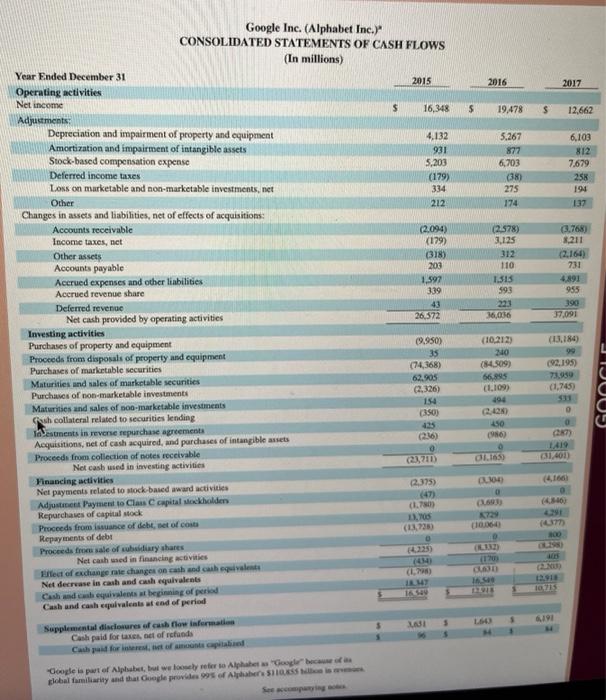
Apple and Google work to maintain high-quality and low-cost operations. One ratio routinely computed for this assessment is the cost of goods sold divided by total expenses. A decline in this ratio can mean that the company is spending too much on selling and administrative activities. An increase in this ratio beyond a reasonable level can mean that the company is not spending enough on selling activities. Use Apple's financial statements in Appendix A. (Assume for this analysis that total expenses equal the cost of goods sold plus total operating expenses.) Required 1. For Apple and Google, compute the ratios of cost of goods sold to total expenses for Apple and Google during the fiscal years 2017 and 2016. 2. Which company had a greater percentage reduction in selling and administrative expenses in 2017? Complete this question by entering your answers in the tabs below. Required 1 Required 2 For Apple and Google, compute the ratios of cost of goods sold to total expenses for Apple and Google during the fiscal years 2017 and 2016. (Record answers as percents, rounded to one decimal.) Apple Google 2017 2016 2107 2016 Ratio of cost of goods sold to total expenses % % % Required Required 2 > % September 24, 2016 Apple Inc. CONSOLIDATED BALANCE SHEETS (In millions, except number of shares which are reflected in thousands and par value) September 30, 2017 ASSETS Current assets Cash and cash equivalents 20.289 Short-term marketable securities 53,892 Accounts receivable, less allowances of $58 and $53, respectively 17,874 Inventories 4,855 Vendor non-trade receivables 17.799 Other current assets 13,936 Total current assets 128,645 Long-term marketable securities 194,714 Property, plant and equipment, net 33,783 Goodwill 5,717 Acquired intangible assets, net 2,298 Other non-current assets 10.162 Total assets $ 375,319 20.484 46,671 15.754 2,132 13.545 8,283 106,869 170,430 27,010 5,414 3.206 8,757 321,686 S LIABILITIES AND SHAREHOLDERS' EQUITY Current liabilities Accounts payable $ Accrued expenses Deferred revenue Commercial paper Current portion of long-term debt Total current liabilities Deferred revenue, non-current Long-term debt Other non-current liabilities Total liabilities Commitments and contingencies Shareholders' equity Common stock and additional paid-in capital, 50.00001 par value: 12,600,000 shares authorized: 5,126,201 and 5,336,166 shares issued and outstanding, respectively Retained earnings Accumulated other comprehensive income (loss) Total shareholders' equity Total liabilities and shareholders' equity See accompanying Notes to Consolidated Financial Statements 49.049 25.744 7,548 11.977 6,496 100,814 2,836 97,207 40,415 241,272 37,294 22,027 8,080 8.105 3.500 79,006 2,930 75,427 36,074 193,437 35,867 98,330 (150) 134,047 375,319 31.251 96,364 634 128,249 321.686 APPLE September 26, 2015 233,715 140,089 93,626 Apple Inc. CONSOLIDATED STATEMENTS OF OPERATIONS (In millions, except number of shares which are reflected in thousands and per share amounts) Years ended September 30, 2017 September 24, 2016 Net sales 229,234 215,639 Cost of sales 141,048 131,376 Gross margin 88,186 84.263 Operating expenses Research and development 11,581 10,045 Selling, general and administrative 15,261 14,194 Total operating expenses 26,842 24,239 Operating income 61,344 60,024 Other income (expense), net 2,745 1,348 Income before provision for income taxes 64,089 61,372 Provision for income taxes 15.738 15,685 Net income 48,351 45.687 8,067 14.329 22,396 71,230 1.285 72 515 19.121 53,394 $ $ 9.28 9.22 $ Earnings per share Basic $ 9.27 $ 8.35 Diluted $ 9.21 8.31 Shares used in computing earnings per share Basic 5,217.242 5,470.820 Diluted 5.251,692 5,500,281 Cash dividends declared per share s 2.40 s 2.18 See accompanying Notes to Consolidated Financial Statements. 5,753,421 5.793,069 1.98 5 (411) Apple Inc. CONSOLIDATED STATEMENTS OF COMPREHENSIVE INCOME (In millions) Years ended September 30, 2017 September 24, 2016 September 26, 2015 Net income S 48,351 $ 45.687 s 53,394 Other comprehensive income (oss): Change in foreign currency translation, net of tax effects of ${77). 58 and 5201, respectively 224 75 Change in unrealized gains/losses on derivative Instrumente Change in fair value of derivatives, net of tax benefit (expense) of S(478). $(7) and 5(441), respectively 1,315 7 2005 Adjustment for net (gains) losses realized and included in net income net of tax expense benefit of $175.5131 and 5630, respectively (1477) (741) (3.497 Total change in unrealized pains/losses on derivative instruments, net of tax (162) (592) Change in unrealized painosses on marketable securities Change in fair value of marketable securities, net of tax benefit (expense) of $425, 5(863) and $264, respectively (782) 1.5R2 (480) Adjustment for et gains) losses realized and included in net income, net of tax expense hect) of $35, 5031 and 32). respectively (65) 56 59 Total change in unrealized and losses on marketable securities net of tax (846) 1.638 (426) Total other comprehensive income (los) 784) 979 (1427) Total comprehensive income 5 47.567 46066 $1.967 rinnanir Nato Consolidated Financial Statements - Il Apple Inc. CONSOLIDATED STATEMENTS OF SHAREHOLDERS' EQUITY (In millions, except number of shares which are reflected in thousands) Accumulated Other Common Stock and Additional Paid-In Capital Comprehensive Total Retained Income Shareholders Shares Amount Earnings Loss) Equity Balances as of September 27, 2014 5,866,161 $ 23,313 $ 87.152 S 1.082 $ 111,547 Net income 53,394 53,394 Other comprehensive income (loss) (1.427) (1.427) Dividends and dividend equivalents declared (11,627) (11.627) Repurchase of common stock (325,032) (36,026) (36,026) Share-based compensation 3,586 3,586 Common stock issued, net of shares withheld for employee taxes 37.624 (231) (609) (840) Tax benefit from equity awards, including transfer pricing adjustments 748 748 Balances as of September 26, 2015 5,578,753 $ 27,416 $ 92,284 $ (345) $ 119,355 Net income 45,687 45,687 Other comprehensive income (loss) 979 979 Dividends and dividend equivalents declared (12,188) (12.188) Repurchase of common stock (279,609) (29,000) (29,000) Share-based compensation 4,262 4.262 Common stock issued, net of shares withheld for employee taxes 37,022 (806) (419) (1,225) Tax benefit from equity awards, including transfer pricing adjustments 379 379 Balances as of September 24, 2016 5,336,166 s 31,251 $ 96,364 $ 634 $ 128.249 Net income 48,351 48,351 Other comprehensive income (loss) (784) (784) Dividends and dividend equivalents declared (12.803) (12.803) Repurchase of common stock (246,496) (33,001) (33,001) Share-based compensation 4.909 4.909 Common stock issued, net of shares withheld for employee taxes 36,331 (913) (581) (1.494) Tax benefit from equity awards, including transfer pricing adjustments 620 Balances as of September 30, 2017 5.126,2015 35.867 S 98,3105 (150) $ 13:4047 See accompanying Notes to Consolidated Financial Statements - LI 620 ICV September 26, 2015 $ 13,844 53.394 11.257 3.586 1,382 385 417 (238) (3.735) (283) 5.001 1,042 9,058 81,266 Apple Inc. CONSOLIDATED STATEMENTS OF CASH FLOWS (In millions) Years ended September 30, 2017 September 24, 2016 Cash and cash equivalents, beginning of the year 20,484 21.120 Operating activities Net income 48.351 45,687 Adjustments to reconcile net income to cash generated by operating activities: Depreciation and amortization 10,157 10,505 Share-based compensation expense 4,840 4,210 Deferred income tax expense 5,966 4.938 Other (166) 486 Changes in operating assets and liabilities: Accounts receivable, net (2.093) 527 Inventories (2.723) 217 Vendor non-trade receivables (4.254) (51) Other current and non-current assets (5,318) 1,055 Accounts payable 9,618 1,837 Deferred revenue (626) (1,554) Other current and non-current liabilities (154) 2,033 Cash generated by operating activities 63,598 65,824 Investing activities Purchases of marketable securities (159,486) (142,428) Proceeds from maturities of marketable securities 31.775 Proceeds from sales of marketable securities 21,258 94.564 90,536 Payments made in connection with business acquisitions, net (329) (297) Payments for acquisition of property, plant and equipment (12,451) (12,734) Payments for acquisition of intangible assets (344) (814) Payments for strategic investments, net (395) (1.388) Other 220 (110) Cash used in investing activities (46.446) (45.977) Financing activities Proceeds from issuance of common stock 555 495 Excess tax benefits from equity awards 627 407 Payments for taxes related to net share settlement of equity awards (1.874) (1.570) Payments for dividends and dividend equivalents (12,769) (12.150) Repurchases of common stock (32.900) (29,722) Proceeds from issuance of term debt. Det 28,662 24.954 Repayments of term debt 3.500) (2.500) Change in commercial paper.net 3.852 (397) Cash used in financing activities (17.347 (20.483) Incrente (decrease in cash and cash equivalents (195) (636 Cash and cath equivalents, end of the year 20,289 20.484 $ Supplemental cash flow disclosure Cash paid for income taxes, bet s 11.591 5 10.444 S Cash paid for interest S 2,092 $ 1316 $ See accompanying Notes to Consolidated Financial Statements (166,402) 14,538 107,447 (343) (11,247) (241) (26) 56,274) 543 749 (1499) (11.561) (35.253) 27.114 2,191 (17,716) 7.275 21, 120 13.252 514 APPLE INC. SELECTED NOTES TO CONSOLIDATED FINANCIAL STATEMENTS Basis of Presentation and Preparation In the opinion of the Company's management, the consoli dated financial statements reflect all adjustments, which are normal and recurring in nature, necessary for fair financial statement presentation The Company's fiscal year is the 52 or 53-week period that ends on the last Saturday of September. The Company's fiscal year 2017 included 53 weeks and ended on September 30, 2017 A 14th week was included in the first fiscal quarter of 2017, as is done every five or six years, to realign the Company's fiscal quarters with calendar quarters. The Company's fiscal years 2016 and 2015 ended on September 24. 2016 and September 26, 2015, respectively, and spanned 52 weeks each. Unless otherwise stated, references to particu lar years, quarters, months and periods refer to the Company's fiscal years ended in September and the associated quarters, months and periods of those fiscal years. Revenue Recognition Net sales consist primarily of revenue from the sale of hard- ware, software, digital content and applications, accesso- nies, and service and support contracts. The Company recognizes revenue when persuasive evidence of an ar rangement exists, delivery has occurred, the sales price is fixed or determinable and collection is probable Product is considered delivered to the customer once it has been shipped and title, risk of loss and rewards of ownership have ben transferred. For most of the Company's product sales, diese criteria are met at the time the product is shipped. For online sales to individuals, for some sales to education customers in the US, and for certain other sales, the Company defers revenue until the customer receives the product because the Company retains a portion of the risk of loss on these sales during transit. For payment terms in excess of the Company's standard payment terms, revenue is recognized as payments become due unless the Company has positive evidence that the sales price is fixed or deter minable, such as a successful history of collection, without concession, on comparable arrangements. The Company recognizes revenue from the sale of hardware products software bundled with hardware that is essential to the functionality of the hardware and third-party digital content sold on the iTunes Store in accordance with general revenue recognition accounting guidance. The Company recognizes revenue in accordance with industry specific software ac counting guidance for the following types of sales transa tions: standalone sales of software products, sales of software upgrades and sales of software handled with hardware not essential to the functionality of the hardware For the sale of most third-party products, the Company recognizes revenue based on the gross montilled to cus tomers because the Company establishes its pricing for such products, retains related inventory risk for physical products, is the primary obligor to the customer and assumes the credit risk for amounts billed to its customers. For third- party applications sold through the App Store and Mac App Store and certain digital content sold through the iTunes Store, the Company does not determine the selling price of the products and is not the primary obligor to the customer. Therefore, the Company accounts for such sales on a net ba- sis by recognizing in net sales only the commission it retains from each sale. The portion of the gross amount billed to customers that is remitted by the Company to third-party app developers and certain digital content owners is not reflected in the Company's Consolidated Statements of Operations The Company records deferred revenue when it receives payments in advance of the delivery of products or the perfor mance of services. This includes amounts that have been de- ferred for unspecified and specified software upgrade rights and non-software services that are attached to hardware and software products. The Company sells gift cards redeemable at its retail and cline stores, and also sells gift cards redeem- able on iTunes Store, App Store, Mac App Store, TV App Store and iBooks Store for the purchase of digital content and software. The Company records deferred revenue upon the sale of the cand, which is relieved upce redemption of the card by the customer Revenge from AppleCare service and sup- port contracts is deferred and recognized over the service coverage periods. AppleCare service and support contracts typically inclode extended phone support, repair services, web-based support resources and diagnostic tools offered un- the Company's standard limited warranty The Company records reductions to revenge foresti mated commitments related to peice protection and other customer incentive programs. For transactions involving price protection, the Company recognizes revenue set of the estimated amount to be refunded. For the Company's other customer incentive programs, the estimated cost of these programs is recognized at the later of the date at which the Company has sold the product or the date a which the program is offered. The Company also records reductions to revenue for expected future product returns based on the Company's historical experience. Revenue is recorded set of taxes collected from customers that are re- mitted to governmental thorities, with the collected tates recorded as cut test mitted to the relevant government authority Formul-clement arrangements that include hardware products containing sessential to the hardware prod- t's functionality delivered software elements that relate to the hardware products essential software and under erndo- se services, the Company allocates revenue to all deliverables based on the relative selling prices For sales of quality versions of iPhone, iPad, iPod touch, Mac, Apple Watch and Apple TV, the Company has APPLE Apple Inc. Notes-continued indicated it may from time to time provide future unspeci- fied software upgrades to the device's essential software Earnings Per Share and/or non-software services free of charge. The Company Basic earnings per share is computed by dividing income has identified up to three deliverables regularly included in available to common shareholders by the weighted average arrangements involving the sale of these devices. The number of shares of common stock cotstanding during the Company allocates revenue between these deliverables us- period Diluted earnings per share is computed by dividing ing the relative selling price method. Revenue allocated to income available to common shareholders by the weighted the delivered hardware and the related essential software is average number of shares of common stock outstanding recognized at the time of sale, provided the other conditions during the period increased to include the number of addi- for revenue recognition have been met. Revenue allocated tional shares of common stock that would have been out- to the embedded unspecified software upgrade rights and standing if the potentially dilutive securities had been the non-software services is deferred and recognized on a issued straight-line basis over the estimated period the software upgrades and non-software services are expected to be pro- Cash Equivalents and Marketable Securities vided. Cost of sales related to delivered hardware and re- Al highly liquid investments with marities of three months lated essential software, including estimated warranty costs or less at the date of purchase are classified as cash equiva are recognized at the time of sale. Costs incurred to provide lents. The Company's marketable debt and equity securities non-software services are recognized as cost of sales as in has been classified and accounted for as available for sale curred, and engineering and sales and marketing costs are Management determines the appropriate classification of its recognized as operating expenses as incurred investments at the time of purchase and reevaluates the clas sifications at each balance sheet date. The Company class Shipping Costs fies its marketable debe securities as either short-term o Amounts billed to customers related to shipping and han Jong-term based on each instrument's underlying contrac dling are classified as revenue, and the Company's shipping tual maturity date Marketable debt securities with matur and handling costs are classified as cost of sales. ties of 12 months or less are classified as short-term and marketable debt securities with maturities greater than Warranty Costs 12 months are classified as long-term Marketable equity The Company generally provides for the estimated cost of securities, including mual funds are classified as either short-term or loog-term based on the nature of each co- hardware and software warranties in the period the related rity and its availability for use in current operations. The revenue is recognized. The Company assesses the adequacy Company's marketable debt and equity securities are car Yof its acerued warranty liabilities and adjusts the amounts ried at fair value with unrealised gains and losses, set of Jos necessary based on actual experience and changes in fu- te reported as a component of accumulated other com ture estimates prehensive income loss) C'AOC in scholdiers' equity Software Development Costs with the exception of realized losses believed to be other than temporary which are reported in earnings in Research and development (R&D) costs are expensed as the current period. The cost of securities sold is based upon incurred. Development costs of computer software to be the specific Identification method sold, leased, or otherwise marketed are subject to capital station beginning when a product's technological feasibility Accounts Receivable Trade Receivable) has been established and ending when a product is available The Company has considerable de recevables outstanding for general release to customers. In most instances, the with third party cellular work carries wholesalers, Company's products are released soon after technological tailers, value addedreselen, small and mid-sized businesses feasibility has been established and as a result software de and education enterprise and government customers velopment costs were expensed as incurred As of September 20, 2017, the Company had two cu toos that individually represented 10% or more of total Advertising Costs trade receivable each of which accounted for 105. As of Advertising costs are expensed as incurred and included in September 24, 2016, the Company has one customer that selling, general and administrative expenses represented 10 or more of total de recevables, which Other Income and Expense accounted for 10%. The Company's celular nerwork carri- er account for 59 and 635 of trade receivables as of 2016 2015 September 30, 2017 and September 24, 2016, respectively and divided income 55.2013199 5201 (233) Alle for the bal Accounts Interest Other expense, The Company records is allowance for doubtful Totalheres 52.7 SE SI based upon its seat of various factors, including 2012 APPL Apple Inc. Notes continued historical experience, age of the accounts receivable bal- The Company does not amortize goodwill and intangi ances, credit quality of the Company's customers, current ble assets with indefinite useful lives, rather, such assets are economic conditions and other factors that may affect the required to be tested for impairment at least annually or customers' abilities to pay sooner if events or changes in circumstances indicate that Inventories the assets may be impaired. The Company performs its Inventories are stated at the lower of cost, computed using goodwill and intangible asset impairment tests in the fourth the first-in, first-out method, and net realizable value. Any quarter of each year. The Company did not recognize any adjustments to reduce the cost of inventories to their net real- impairment charges related to goodwill or indefinite lived intangible assets during 2017, 2016 and 2015. For purposes izable value are recognized in earnings in the current period. of testing goodwill for impairment, the Company estab Property, Plant and Equipment lished reporting units based on its current reporting struc- ture. Goodwill has been allocated to these reporting units to Property, plant and equipment are stated at cosi the extent it relates to each reporting unit. In 2017 and Depreciation is computed by use of the straight-line method 2016, the Company's goodwill was primarily allocated to over the estimated useful lives of the assets, which for the Americas and Europe reporting units buildings is the lesser of 30 years or the remaining life of The Company amortizes its intangible assets with defi- the underlying building: between one and five years for ma- nite useful lives over their estimated useful lives and te chinery and equipment, including product tooling and man- views these assets for impairment. The Company typically ufacturing process equipment and the shorter of lease term amortizes its acquired intangible assets with definite aseful or useful life for leasehold improvements. The Company lives over periods from three to seven years. capitalizes eligible costs to acquire or develop internal-use software that are incurred subsequent to the preliminary Acquired Intangible Assets project stage. Capitalized costs related to internal-use soft- The Company's acquired intangible assets with definite ware are amortized using the straight-linc method over the useful lives primarily consist of patents and licenses. The estimated useful lives of the assets, which range from three following table summarizes the components of acquired to five years. Depreciation and amortization expense on intangible asset balances as of September 30, 2017 property and equipment was $8.2 billion, 58.3 billion and Amortization expense related to acquired intangible assets $9.2 billion during 2017, 2016 and 2015, respectively. was $1.2 billion in 2017. Property, Plant and Equipment, Net Gro Net (5 millions) 2017 2016 Carrying led Carrying S Amunt Land as a buildings S 13.587 5 10,18 ta anal Deived and more Machinery, equipment and interese software 54.210 44.563 and intangibles $ 7.3075 5.309) 5 2,198 Lasthold improvements 2.229 6512 Indefined and we Grous property, plant and equipment 75.076 61.345 dintables 100 Accumulated depreciation and mortation 1.293) (34.215) Tocal acquired intangibles $75 5.30%) 5 29 Total property, plant and equipment, et $33.783 5 27.010 Fair Value Measurements Long Lived Assets Including Goodwill and Other The Company applies fair value accounting for all finan- Acquired Intangible Assets cial assets and liabilities and non-financial assets and li The Company reviews property, plant and equipment, in- abilities that are recognized or disclosed at fair value in ventory component prepayments and identifiable intangi the financial statements on a recurring basis. The bles, excluding goodwill and intangible assets with Company defines fair value as the price that would be re indefinite useful lives, for impairment. Long-lived assets ceived from selling an asset or paid to transfer a liability are reviewed for impairment whenever events or changes in in an orderly transaction between market participants at circumstances indicate the carrying amount of an asset may the measurement date. When determining the fair value not be recoverable. Recoverability of these assets is mea measurements for assets and liabilities that are required sured by comparison of their carrying amounts to future to be recorded at fair value, the Company considers the undiscounted cash flows the assets are expected to gener principal or most advantageous market in which the ate. If property, plant and equipment, inventory component Company would transact and the market-based risk mea propayments and certain identifiable intangibles are consid- surements or assumptions that market participants would cred to be impaired, the impairment to be recognised equals wie to price the asset or liability, such as risks inherent in the amount by which the carrying value of the asset exceeds valuation techniques, transfer restrictions and credit risk. its fair value Fair value is estimated by applying the following hierarchy. Apple Inc. Notes continued Dividends The Company declared and paid cash dividends per share during the periods presented as follows: 2017 2016 Dividends Amount Dividends Amount Per Share (in millions) Per Share (in millions) Fourth quarter $ 0.63 3.2525 0.57 $ 3,071 Third quarter 063 3281 0.57 3.117 Second quarter 037 2,988 032 2.879 First quarter 3,042 052 2.898 Total cash dividends declared and paid $ 240$ 12,563 S 2185 11.965 057 Segme In rmation and Geographie Data which prioritizes the inputs used to measure fair value into three levels and bases the categorization within the hierarchy upon the lowest level of input that is available and significant to the fair value measurement: Level 7Quoted prices in active markets for identical assets or liabilities Level 2Observable inputs other than quoted prices in ac tive markets for identical assets and liabilities, quoted prices for identical or similar assets or liabilities in inactive mar kets, or other inputs that are observable or can be corrobo- rated by observable market data for substantially the full term of the assets or liabilities. Level 3 --Inputs that are generally unobservable and typically reflect management's estimate of assumptions that market participants would use in pricing the asset or liability, The Company's valuation techniques used to measure the fair value of money market funds and certain marketable equity securities were derived from quoted prices in active markets for identical assets or liabilities. The valuation techniques used to measure the fair value of the Company's debt instruments and all other financial instruments, all of which have counterparties with high credit ratings, were valued based on quoted market prices or model-driven val- uations using significant inputs derived from or corrobo- rated by observable market data. In accordance with the fair value accounting require- ments, companies may choose to measure eligible financial instruments and certain other items at fair value. The Company has not elected the fair value option for any eli- gible financial instruments, Accrued Warranty and Indemnification The following table shows changes in the Company's ac- crued warranties and related costs for 2017 and 2016: 5 millions 2017 2016 Beginning trued warranty and related costs $ 3,702 $ 4.780 Cost of warranty claims (4,322) Accruals for product warranty 3.RS Ending accrued warranty and related costs 53,834 33,702 Net sales by product imil) iPhone Pad Mac Services Other Products Total net sales 2017 $141,319 19.222 25.850 29.980 12,863 $229,234 2016 $136.700 20,628 22.831 24,348 11.12 S215.619 2015 $155.041 20.227 25,471 19.909 10,067 $213.715 2017 2016 2015 396,600 $30,684 $86,613 $28.172 593,864 $31,186 Keportable segment) America Not sales Operating income Europe Net sales Operating income Greater China: 554.938 $16,514 549.952 $15.348 $ 0.037 5 16.327 Net sales $44,764 $17,032 548,492 SIRS 558,715 $ 21.00 14.663) Operating income Japan Net sales Operating income Rest of Asia Pacific Net als Operating income $17,70 $ 8,097 516928 $ 2,165 $15.70 $ 7.617 4.454 SIS,199 55104 $13,054 $ 4781 $ 15,093 S SS A reconciliation of the Company's segment operating in come to the Consolidated Statements of Operations for 2017, 2016 and 2015 is as follows: Term Debt As of September 30, 2017, the Company had outstanding floating and fixed-rate notes with varying maturities for an aggregate principal amount of $104.0 billion (collectively the "Notes"), The Notes are senior unsecured obligations, and interest is payable in arrears. The Company recognized $2.2 billion, $1.4 billion and $722 million of interest expense on its term debt for 2017 2016 and 2015, respectively As of September 30, 2017 and September 24, 2016, the fair value of the Company's Notes, based on Level 2 inputs, was $106.1 billion and $81.7 billion, respectively, 2017 577.631 2016 5 74.101 2015 SO millions Segment operating income Research and development ce Other poste per Total operating income CHISH) (200 561 (10,045) ( 410) 360034 50 As of December 31, 2017 10.715 91.156 LOSTI 1136 160 749 2.983 134308 7.813 AND 2,573 Geople Inc. (Alphabet Inc.) CONSOLIDATED BALANCE SHEETS (In millions, except share and par value amounts which are reflected in thousands and par value per share amounts) As of December 31, 2016 Assets Current assets Cash and cash equivalents 12.918 Marketable securities 73,415 Total cash, cash equivalents, and marketable securities 86.30 Accounts receivable, net of allowance of $467 and 5874 14.137 Income taxes receivable.net 93 Inventory 258 Other current assets 575 Total current assets 105.08 Non-marketable investments 5.78 Deferred income taxes 383 Property and equipment, net Intangible ans, net 07 Goodwill 16,455 Other bon-current assets ISIS Total assets 167.97 Liabilities and Stockholders' Equity Current liabilities Accounts payable 2041 Accrued compensation and benefits Accued expenses and other current babilities Accrued revenue share 290 Deferred revenue LO Inore taxes payable, et Thetal current abilities Long-term debet 200 Deferred revenue 4877 Income tax payable, concurrent Deferred income tases Other long-term as Total liabilities Comm.ments and clics Stockholders' equilty Convertible preferred stock. 50.001 per value per 100.000 authored and outstanding Class A and Class B como dock and Claus Capital sock and dditional pada capital, SO Opavalo per 1.000.000 shares authorized A9.000.000,Class.com Class 3,000,000 6919 A26.992.47.0 Cu C346.864) and 3 C A 29.470 CATE Class 349.341) share and standing landathartemuria kaa Retained earning Talent Total libes and holdn't 17 177 123 40 Google is part of Alphabet uw to Alloh family and that Google poids of Alpes 2016 90.272 $ 2017 110,855 $ Google Inc. (Alphabet Inc.)" CONSOLIDATED STATEMENTS OF INCOME (In millions) Year Ended December 31 2015 Revenues 74,989 Costs and expenses Cost of revenues 28.164 Research and development 12.282 Sales and marketing 9.017 General and administrative 6,136 European Commission fine 0 Total costs and expenses 55,629 Income from operations 19,360 Other income (expense), net 291 Income before income taxes 19,651 Provision for income taxes 3,303 Net income 5 16,348 Less. Adjustment Payment to Class C capital stockholders Net income available to all stockholders 5 15,826 35,138 13.948 10,485 6,985 0 66.556 23.716 434 24,150 4,672 19,478 0 19,478 45.583 16,625 12.93 6,872 2.736 84,709 26.146 1.047 27.193 14.531 12,662 $ $ $ $ "Google is part of Alphabet, but we loosely refer to Alphabet as "Google" because of its global familiarity and that Google provides 99% of Alphabet's $110,855 billion in revenues. See accompanying notes I Google Inc. (Alphabet Inc.) CONSOLIDATED STATEMENTS OF COMPREHENSIVE INCOME (In millions) 19005 2017 2015 16.45 2016 19,478 5 1.543 (7059 014 Year Ended December 31 Net income Other comprehensive income (los): Change in foreign currency translation adjustment Available for sale investments Change in net realized pains (losses) Less: reclassification adjustment for net(gains) losses included in income Nel change (set of tax effect of $29, 50, and so) Cash flow hedges: Change in net unrealized gains Close) Les reclassification adjustment for et pains) losses included in net income Net change Coet of tax effect of 115.564, 5247) Other comprehensive income (los) Comprehensive income 10 413 1931 (100) 0327 L.SOD 515 151) 164 1,410 14073 ISO 5 Google is part of Alphabet, but we loosely refer to Alphabet as "Google" because of its global familiarity and that Google provides 995 of Alphabet's S110355 billion in See accompanying 664 0 0 Google Inc. (Alphabet Inc.)" CONSOLIDATED STATEMENTS OF STOCKHOLDERS' EQUITY (In millions, except share amounts which are reflected in thousands) Class A and Class B Common Stock, Class C Accumulated Capital Stock and Other Total Additional Paid-In Capital Comprehensive Retained Stockholder Shares Amount Income (Loss) Balance as of December 31, 2014 Earnings Equity 680,172 S 28,767 $ 27 S Common and capital stock issued 75,066 $ 103,860 8,714 664 0 0 Stock-based compensation expense 0 5.151 0 0 5.151 Stock-based compensation tax benefits 0 815 0 0 815 Tax withholding related to vesting of restricted stock units (2.779) 0 0 Repurchases of capital stock (2.779) (2,391) (111) 0 (1.669) (1.780) Adjustment Payment to Class C capital stockholders 853 475 0 (522) (47) Net income 0 0 0 16,348 16,348 Other comprehensive loss 0 (1.901) 0 (1.901) Balance as of December 31, 2015 687,348 32,982 (1.874) 89,223 120,331 Cumulative effect of accounting change 0 180 0 (133) 47 Common and capital stock issued 9,106 298 0 0 298 Stock-based compensation expense 0 6,700 0 6,700 Tax withholding related to vesting of restricted stock units 0 (3.397) 0 0 (3.597) Repurchases of capital stock (5,161) (56) 0 (3,437) 3.693) Net income 0 0 19,478 19.478 Other comprehensive loss 0 0 (528) 0 (528) Balance as of December 31, 2016 691,293 36 307 (2,402) 105.131 139,036 Cumu tive effect of accounting change (15) (15) Comnar and capital stock issued 8.652 212 0 212 Stock-based compensation expense 0 7.694 0 0 7,694 0 Tax withholding related to vesting of restricted stock units (4,373) 0 0 (14.373) Repurchases of capital stock (5.162) (315) (4.531) (4.846) 0 722 Sale of subsidiary shares 0 0 722 Net income 0 0 0 12,662 12.662 0 Other comprehensive loss 0 0 1.410 1.410 Balance as of December 31, 2017 694,783 S 40,247 $ (992) 5 113.2475 152,500 0 0 0 DO "Google is part of Alphabet, but we loosely refer to Alphabet as "Google" because of its global familiarity and that Google provides 99% of Alphabet's $110,855 billion in revenues. See accompanying notes 2016 2017 5 19.478 $ 12,662 4,132 5.267 877 6,703 6,103 812 7.679 258 1944 137 (179) (38) 334 275 174 (2.578) 1125 312 110 1.315 (3.768) 8.211 (2.164) 731 4,891 955 390 37.091 593 223 16.036 Google Inc. (Alphabet Inc.) CONSOLIDATED STATEMENTS OF CASH FLOWS (In millions) Year Ended December 31 2015 Operating activities Net income $ 16,348 Adjustments Depreciation and impairment of property and equipment Amortization and impairment of intangible assets 931 Stock-based compensation expense 5.203 Deferred income taxes Los on marketable and non-marketable investments, net Other 212 Changes in assets and liabihties, net of effects of acquisitions: Accounts receivable (2.094) Income taxes, net (179) Other assets (318) Accounts payable 203 Accrued expenses and other liabilities 1,597 Accrued revenue share 339 Deferred revenue 43 Net cash provided by operating activities 26,372 Investing activities Purchases of property and equipment (9.950) Proceeds from disposals of property and equipment 35 Purchases of marketable securities (74,368) Maturities and sales of marketable securities Purchases of non-marketable investments 2,326) Maturities and sales of non-marketable investments 154 Cash collateral related to securities lending SO) Testments in reverse repurchase agreement Acquisitions, net of cash acquired, and purchases of intangible assets (236) Proceeds from collection of notes receivable 0 Net cash used in investing activities (270 Financing activities 2,375) Nel payments related to stock based award activities (47) Adjustment Payment to Claus Capital sockholders (17) Repurchases of capital stock 13.05 Proceeds from Issuance of debt, set of cost Repayments of debt 0 Proceeds from sale of subsidiary shares Net cash used in financing waves Effect of exchange me changes on cash and caregives CL) Net decrease in cash and cush equivalents Cash and chequivalente beginning of period Cash and cash equivalente at end of period Supplemental disclosure of cash flow informatie Caspaid for en el of funds Cahid for of contacte (10.212) 2140 (84509) 56.95 (1109) (13,184) 99 (92.195) IC (1,745 JIJUUS 0 2.420 450 (6 1.419 10 1650 104 LAN (446) 10060 (7 300 (1) IAS 191 Google is part of Alphabet, but well refer to Alphabets Google because global familiarity and that Google provides of A1105 Samsung Electronics Co., Ltd. and Subsidiaries CONSOLIDATED STATEMENTS OF FINANCIAL POSITION (in millions of Korean Won) December 31, 2017 December 31, 2016 Assets Current assets KRW KRW Cash and cash equivalents Short-term financial instruments 30.545.130 32.111.442 Short-term wailable-for-sale financial assets 19.447.696 52.432.411 U191.375 Trade receivables 3.638,450 Non-trade receivables 27.695.995 24.279, 211 Advance payments 4108951 2521,197 1.753573 1.439.914 Prepaid expenses 3835219 Inventones 302.083 24.983355 38.353_503 Other current assets 1.421.060 315.60 Assets held for sale 3. Total current assets 146,983,464 141.403,704 Non-current assets Long-ters available for sale financial 7.752.180 694275 Held-to-maturity financial assets 105751 Investment in associates and joint ventures 68022151 52764 Property, plant and equipment 111.665.48 91.44 Intangible at 147600 344020 Long-term prepaid expenses 3.434 375 230 Net defined benefit assets 5.92 557.091 Deferred income tax assets 5.36147 5321,450 Other non-currentes 16035 Total acts 301,752 TU Liabilities and Equity Current liabilities Trade payables 9 Short-term borrowing 15.151.599 12.767 Other payables 9.60 159 Advances received . Accrued expenses 36273 7. 2010 Income tax payable a portion of long-term labi Provisions Other current liabilities Libilities held for sale Total current liabilities No-current liabilities Debetes Long-term borowings 2017 Long-term her payables Ne defined benefit ab Deferred tax babe 4304 Provision Dha Malaises Tutallaties Equity attributable town of the para Preference share TO Ordinary Share pe Retaineering Other components of equity Accumulated the cable Nos controlling Tutal equally Total and equity They Samsung Electronics Co., Ltd. and Subsidiaries CONSOLIDATED STATEMENTS OF PROFIT OR LOSS For the year ended December 31 2017 (in millions of Korean won) KRW Revenue 239,575.376 Cost of sales 129.290.661 Gross profit 110.284,715 Selling and administrative expenses 56,639.677 Operating profit 53.645,038 Other non-operating income 3010657 Other non-operating expense 1.419,565 Share of profit of associates and joint ventures 201 442 Financial income 9.737.391 Financial expense 8978913 Profit before income tax 56,195.967 Income tax expense 14.09.220 Profit for the period 42,186,347 Profit attributable to owners of the parent 41.3456 Profit attributable to non-controlling interests Earnings per share ---Basic 299.568 299 -Diluted The above consolidated statement of financial position should be read in conjunction with the company 2016 KRW 201.856,745 120.277,715 81.59 52,348 358 29.340.72 3.23.261 2.43.14 19.501 11.385.545 10.706.613 03452 7587560 22,725.000 22.415.455 330437 157967 157.57 Samsung Electronics Co., Ltd. and Subsidiaries CONSOLIDATED STATEMENTS OF COMPREHENSIVE INCOME 2016 2012 KW 14 M 511 For the year ended December 31 (mio of Roman wom) Profit for the period Other comprehensive income do Items not to be reclanified to profit or los senty: Renatol of wat defined benefits of tax Shares of other comprehensive income (om) of ancies and joint ventures of Items to be reclauified to profit or lows subsequently Changes in value of available-for-sale facial, la Share of other comprehensive income of sociedjes Foreign currency translation, et of tax Gain osa) on valuation of derivatives Other comprehensive income down for the period, net of tax Total comprehensive Income for the period Comprehensive income attributable te Owner of the pure Non controlling interes 17.121 IL 34.00 34 MSUNG The above consolidated official Samsung Electronics Co., Ltd. and Subsidiaries CONSOLIDATED STATEMENTS OF CHANGES IN EQUITY part 1 I 1 TILLIT TITLE T Acumulated other comprehensive income Equality Other attributable to attributable Preference Ordinary Non Share Retained in millions of Korean Won Components sueld shares controlling shares premium carnis of equity for-sale interest Total Balance as at January 1, 2016 119,467 778,047 4.403,893 185,132,014 (17,580,451) 23,797 Profit for the period 172.876767 6,183,038 179,059,85 22,415.655 22415,695 310,437 Changes in value of available for sale 22.726,092 financial assets, net of tax (87.706) (23.797) KEHI.500 57,664 (23.839) Share of other comprehensive income (loss) of associates and joint ventures, net of tax (80,146) 212 79.934) 35 (79.899) Foreign currency translation, net of tax 1.160,316 1,160,316 (28,780) 1,131536 Remeasurement of net defined benefit liabilities, net of tax 926,280 926.280 963,000 Classified as held-for-sale 29,022 (29.022) Total comprehensive income (loss) 22,415,655 1,947,766 (52.607) 24,310,814 406,67 24,717,493 Dividends (3,061,361) 3,061 360) (65161) 3.126,522) Capital transaction under common control (37) 37 12.272 12:25 Changes in consolidated entities 1.70 1.790 Acquisition of treasury stock (7.707,938) (7.707.938) 7.707,938) Retirement of treasury stock (11 199,991 1.199,991 Others 6,083 6.00 Total transactions with owners (14,461,352) 3,698,099 (10,76253) (51,011) (10,81426 Balance as at December 31, 2016 119,467 778,047 4,403,893 193,086,317 (11,834,586) (28,810) 186,08 6.538,705 192 Profit for the period 41.344.569 42.344.569 10,178 21, 147 Changes in vte of available for sale financial assets, set of tax 489,150 489,150 22.057 11,300 Share of other comprehensive income Close) of associates and joint ventures niet of tax (540) 54.300) c.) 3. Foreign currency translation of tax 16.289,926) 21,810 Remeasurement of ner defined benci Liabilities, net of tax 4060223 06.123 414,247 Gain (los) on valuation of derivatives 07.121) 20 41.44.49 (5.455,40 INIO Total comprehensive income oss) 7505 MALEN Dividende (6.747,123 747130 1400 (2.9221 Capital transaction under common control 15 2. . (4.142 Changes in considered entities (11) Acquisition of treasury wock 1,600 OD Retirement of cury stack (1.7256) TL256 Other (11.69.16 CAT Total transactions with owners JUILLI Halance as a December 31, 2017 77. 4. 21.00 on 114 LAN 119.467 TILL 1 TL 1 1 LIIIIII 11 The above condimenticia pode with the common UNG Samsung Electronics Co., Ltd. and Subsidiaries CONSOLIDATED STATEMENTS OF CASH FLOWS For the year ended December 31 2017 2016 (In millions of Korean won) KRW Cash flows from operating activities KRW Profit for the period 42,186,747 Adjustments 22,726,092 Changes in assets and liabilities arising from operating activities 36.211.232 30,754,471 Cash generated from operations (10,620 547) (1,180,953) 67.777.432 $2,299.610 Interest received 1.581,117 Interest paid 1.405.08 (542,715) (443,838) Dividends received 173.305 256.851 Income tax paid (6827.098) (6,132,054) Net cash inflow from operating activities 62,162,041 47.385,664 Cash flows from investing activities Net decrease (increase) in short-term financial instruments 387,627 (6,780,610) Disposal of short-term available-for-sale financial assets 499,856 1,010,003 Acquisition of short-term available for sale financial assets 2,129.551) Disposal of long-term financial instruments 1.750,221 789.862 Acquisition of long-term financial instruments (1,079,355) (1.741 547) Disposal of long-term available for sale financial assets 191,826 2,010,356 Acquisition of long-term available-for-sale financial assets (358,497) (1.498.148) Acquisition of held-to-maturity financial assets (106,751) Disposal of investment in associates and joint ventures 355.926 2,280203 Acquisition of investment in associates and joint ventures (25,293) (1.105 Disposal of property, plant and equipment 308.154 270,674 Acquisition of property, plant and equipment (42,792 2:34) (24.142.973) Disposal of intangible assets 733 A944 Acquisition of intangible assets 1983,740) (1.076650 Cash outflow from business combinations (8,754.265 (632,050 Cash inflow from business transfers 1.24884 (28.455) 19.236 Others Nel cash outflow from investing activities (49.365.216 Cash flows from financing activities Net increase in short-term borrowings 2.71076 LOS (79) Acquisition of treasury stock 99311 L, Proceeds from long-term borrowings and debeatures (L140.00 25546 Repayment of long-term borrowings and debetures (L04297 OU Dividends paid 122 Net increase in non-controlling Interest CILSON Nel cash outflow from financing activities Effect of exchange rate changes on cash and can equivalen (1.53 ROL Net (decrease) Increase in cash and cash equivalents Cash and cash equivalents IL Beginning of the period MASIN 1,111,0 End of the period The above consolidated almost of the them JNG