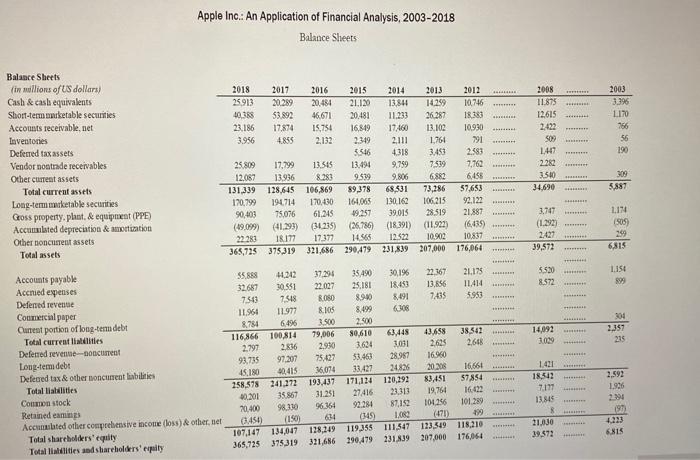
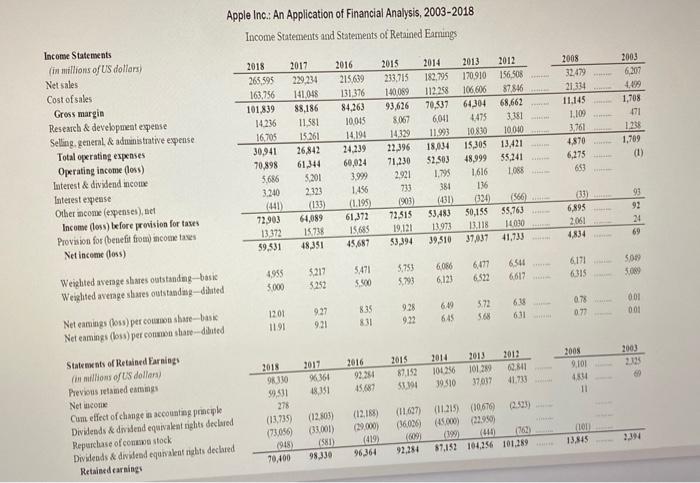
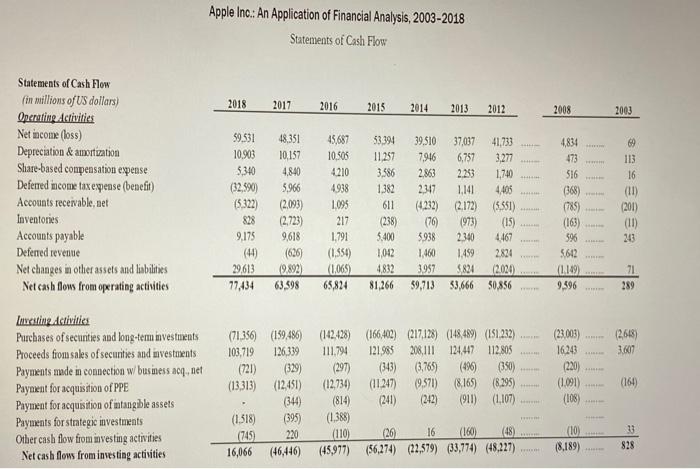
Apple Inc.: An Application of Financial Analysis, 2003-2018 Balance Sheets 2003 3.396 L170 766 56 190 FE Balance Sheets (in willions of US dollars) Cash & cash equivalents Short-term anketable securities Accounts receivable.net Inventories Deferred tax assets Vendor nostride receivables Other current assets Total current assets Long-term marketable securities Gross property.plaut, & equipment (PPE) Acculated depreciation & mortization Other boncurrent assets Total assets 2018 2017 2016 2015 2014 25913 20.289 20.484 21.120 13,841 40.388 53.892 46,671 20,481 11.233 23.186 17.874 15.754 16,849 17460 3.956 4855 2.132 2319 2.111 5.546 4318 25.809 17.799 13.45 13.491 9.759 12.087 13.956 8.283 9.539 9.806 131,339 128.645 106,869 89,378 68,531 170,799 194714 170,430 164,065 130,162 90,403 75.076 61.245 19.257 39.015 (19.099) (41,293) (31.235) (26786 (18.391) 22283 18.177 17.377 14.565 12.522 365,725 375,319 321.686 290479 231,839 2013 2012 10259 10.746 26.287 18181 13.102 10930 1.761 791 3.453 2583 7.539 7,762 6882 6.455 73,286 57,653 92.122 28.519 21.887 (11.922) (6,435) 10.902 10.837 207,000 176,064 2008 11875 12.615 2.422 509 1.47 2282 31510 34.690 RE 309 5.887 106215 3.747 (1.292 2.427 39,572 LIN 1905) 209 6315 EFTER 22.167 13.856 7,435 21.175 11.414 5953 5.520 8.572 1.154 399 on 38.542 2.648 14,092 3009 201 2.357 215 Accounts payable Accred expenses Deferred revenge Commercial paper Current portion of long-teru debt Total current llilities Deferred revenue-Document Lou tem debt Defeared tax & other noncurrent liabilities Total liabilities Common stock Retained eam Accumulated other comprehensive income (loss) & other net Total shareholders' equally Totalliatiities and shareholders' exity 2.635 16.960 35.888 4032 32.687 30581 750 7548 11.964 11971 8754 6.496 116,866 100,814 2.797 2.836 93.75 97.307 45.180 10.415 258,578 241.272 30,201 35867 20.400 98.330 (3450) (150) 107,147 134,017 365,725 375,319 37.294 35.490 30.196 22.027 25.181 18.451 8.080 8.900 8491 8.105 8.499 JOS 3.500 2.500 79,006 80.610 63,448 2.930 3.634 3031 25.07 53.463 28.987 16.074 33.427 24826 193,437 171,124 120,292 27416 23,313 96,364 92.284 87192 634 (149 1.00 128,249 119.355 111,347 321,686 290,479 231.839 2.592 1.946 1.421 18.542 7.177 13.45 LI 20.208 83.451 19,764 104256 (471) 123,319 207.000 3125 16.661 57854 16.422 101289 199 118,210 176,064 197 ILLE 21.030 39,872 6815 Apple Inc: An Application of Financial Analysis, 2003-2018 Income Statements and Statements of Retained Earnings 2003 2017 229.234 141048 88,186 11,581 3.381 Income Statements (in millions of US dollars) Net sales Cost of sales Gross margin Resench & development expense Selling, general. & administrative expense Total operating expenses Operating income (los) Interest & dividend income Interest expense Other come expenses), nel Income (101) before provision for taxes Provision fot (benefit from income taxes Net income (los) 2018 265,595 163,756 101.839 14.236 16,705 30,941 70,898 5.686 3.240 (441) 72,903 13372 59.331 2014 182.795 112.258 70.537 6,00 11.99 18,034 $2.503 1.795 15.261 2016 215.639 131376 84,263 10.045 14,194 24,239 60,024 3,999 1.456 L.195) 61,372 15,685 45.687 2015 213,715 140,089 93,626 8067 14,329 22,396 71,230 2.921 713 (903) 72,513 19.121 33,394 2008 32,479 21.344 11.145 1.109 3.761 4870 6,275 6 2013 2012 170910 1568 106,606 87.846 64,304 68,662 4475 10830 10010 15,305 13421 48,999 1616 136 034 50,155 55,763 13.118 1030 37,037 41,733 6.207 4,099 1,708 171 1238 1.709 (1) 26,842 61,344 3.201 2.123 (133) 55,241 1088 381 (33) 6,895 2061 (431) 53483 13 973 39,510 93 92 24 69 61,089 15.736 48,351 4834 6017 5471 5,753 3.793 4935 3.000 6151 6115 3217 5.252 6066 6.131 SON 5.08 6541 6612 5.500 64 075 001 001 9.27 921 5.72 568 6.09 65 9.25 922 835 831 12.01 1191 072 631 2014 2012 2003 2.35 2005 9.101 Weighted average shares outstanding-batte Weighted average shares outstanding diluted Net eanings (boss) per common shate-bank Net eaming (los) per comma share-diluted Statements of Retained Earnings (in millions of US dollars) Previous retised emings Net.com Cum effect of change in accounting principle Dividends & dividend equivalent rights declared Repurchase of common stock Dividends & dividend equivaleat right declared Retained earnings 2016 92254 15.687 2017 361 48,351 2015 87.152 51.101 2013 10129 37017 100256 39.510 . 411 . 11 2018 9330 59511 278 (11.735) (73055) 1948 70,400 (12.801) (33.001) (881) 98.330 (12.168) (29.600) (119) 96,364 (117) (6.006 16091 92,284 (11.215) (10670 0.333 (3.000) 02950 (199 1410 (16) 87.159101256 101.289 1100 13.815 2.3 Apple Inc.: An Application of Financial Analysis, 2003-2018 Statements of Cash Flow 2018 2017 2016 2015 2014 2013 2012 2008 2003 Statements of Cash Flow fin millions of US dollars) Operating Activities Net income (loss) Depreciation & amortization Share-based compensation expense Deferred income tax expense (benefit) Accounts receivable net Inventories Accounts payable Deferred revenue Net changes in other assets and liabilities Net cash flow from operating activities 59.531 10.903 5,340 (32,590) (5.322) 828 9.175 (40) 29,613 77.434 48,351 10,157 4,840 5.966 (2,093) (2,723) 9,618 (626) 19.892) 63,598 45,687 10,505 4210 4938 1.095 217 1.791 (1,554) (1,065) 65,824 53,394 11.257 3.586 1382 611 (238) 5.400 1012 4,832 81,266 39.510 37,037 41,733 7.916 6,757 3.277 2.863 2.253 1,740 2347 1.141 4405 (4232) 2,172) (5,551) (76) (973) (15) 5938 2340 4467 1,460 1499 2834 3957 5824 2.000 59,713 53,666 50,856 4,834 473 516 (368) (785) (163) 596 5612 1.149) 9.596 09 113 16 (11) (201) (11) 20 71 289 (2618) 3.607 Investing Activities Purchases of securities and long-term investments Proceeds from sales of securities and investments Payments made in connection w business acq.net Payment for acquisition of PPE Payment for acquisition of intangible assets Payments for strategic investments Other cash flow from investing activities Net cash flows from investing activities (71,356) (199,486) (142,428) 103,719 126,339 111.794 (721) (329) (297) (13313) (12,451) (12,734) (344) (814) (1,318) (395) (1,388) (745) 220 (110) 16,066 46446) (45,977) (166,402) (217,128) (148,489) (151.232) 121985 208.111 124,447 112.805 (343) (3,765) (496) (350) (11247) 0,570) (8165) (8.295) (241) (242) (911) (1,107) (23,003) 16243 (220) (1.091) (108) (161) (26) 16 (160) (48) (56,274) (22,579) (33,774) (48,227) (10) (8.189) 333 828 1. Using above information, please prepare common-size balance sheets and income statements for the years 2003 to 2018. What do these summary ratios say about the company in the current year, as well over time? 2. What do you observe about the changes in Apple's performance, liquidity, solvency, and capital structure over the years presented? Use whatever relations and ratios you feel are appropriate for this task. Do your observations fit with what you know about the company's business model and strategy? What surprised you? 3. Please use three ratios from each category (profitability, liquidity & solvency) and justify your analysis 4. Please, use the DuPont analysis of ROE and ROA and provide insight of what this analysis displays. 5. Evaluate the company's current financial performance, liquidity, solvency and capital structure - both for an individual period as well as across time. Apple Inc.: An Application of Financial Analysis, 2003-2018 Balance Sheets 2003 3.396 L170 766 56 190 FE Balance Sheets (in willions of US dollars) Cash & cash equivalents Short-term anketable securities Accounts receivable.net Inventories Deferred tax assets Vendor nostride receivables Other current assets Total current assets Long-term marketable securities Gross property.plaut, & equipment (PPE) Acculated depreciation & mortization Other boncurrent assets Total assets 2018 2017 2016 2015 2014 25913 20.289 20.484 21.120 13,841 40.388 53.892 46,671 20,481 11.233 23.186 17.874 15.754 16,849 17460 3.956 4855 2.132 2319 2.111 5.546 4318 25.809 17.799 13.45 13.491 9.759 12.087 13.956 8.283 9.539 9.806 131,339 128.645 106,869 89,378 68,531 170,799 194714 170,430 164,065 130,162 90,403 75.076 61.245 19.257 39.015 (19.099) (41,293) (31.235) (26786 (18.391) 22283 18.177 17.377 14.565 12.522 365,725 375,319 321.686 290479 231,839 2013 2012 10259 10.746 26.287 18181 13.102 10930 1.761 791 3.453 2583 7.539 7,762 6882 6.455 73,286 57,653 92.122 28.519 21.887 (11.922) (6,435) 10.902 10.837 207,000 176,064 2008 11875 12.615 2.422 509 1.47 2282 31510 34.690 RE 309 5.887 106215 3.747 (1.292 2.427 39,572 LIN 1905) 209 6315 EFTER 22.167 13.856 7,435 21.175 11.414 5953 5.520 8.572 1.154 399 on 38.542 2.648 14,092 3009 201 2.357 215 Accounts payable Accred expenses Deferred revenge Commercial paper Current portion of long-teru debt Total current llilities Deferred revenue-Document Lou tem debt Defeared tax & other noncurrent liabilities Total liabilities Common stock Retained eam Accumulated other comprehensive income (loss) & other net Total shareholders' equally Totalliatiities and shareholders' exity 2.635 16.960 35.888 4032 32.687 30581 750 7548 11.964 11971 8754 6.496 116,866 100,814 2.797 2.836 93.75 97.307 45.180 10.415 258,578 241.272 30,201 35867 20.400 98.330 (3450) (150) 107,147 134,017 365,725 375,319 37.294 35.490 30.196 22.027 25.181 18.451 8.080 8.900 8491 8.105 8.499 JOS 3.500 2.500 79,006 80.610 63,448 2.930 3.634 3031 25.07 53.463 28.987 16.074 33.427 24826 193,437 171,124 120,292 27416 23,313 96,364 92.284 87192 634 (149 1.00 128,249 119.355 111,347 321,686 290,479 231.839 2.592 1.946 1.421 18.542 7.177 13.45 LI 20.208 83.451 19,764 104256 (471) 123,319 207.000 3125 16.661 57854 16.422 101289 199 118,210 176,064 197 ILLE 21.030 39,872 6815 Apple Inc: An Application of Financial Analysis, 2003-2018 Income Statements and Statements of Retained Earnings 2003 2017 229.234 141048 88,186 11,581 3.381 Income Statements (in millions of US dollars) Net sales Cost of sales Gross margin Resench & development expense Selling, general. & administrative expense Total operating expenses Operating income (los) Interest & dividend income Interest expense Other come expenses), nel Income (101) before provision for taxes Provision fot (benefit from income taxes Net income (los) 2018 265,595 163,756 101.839 14.236 16,705 30,941 70,898 5.686 3.240 (441) 72,903 13372 59.331 2014 182.795 112.258 70.537 6,00 11.99 18,034 $2.503 1.795 15.261 2016 215.639 131376 84,263 10.045 14,194 24,239 60,024 3,999 1.456 L.195) 61,372 15,685 45.687 2015 213,715 140,089 93,626 8067 14,329 22,396 71,230 2.921 713 (903) 72,513 19.121 33,394 2008 32,479 21.344 11.145 1.109 3.761 4870 6,275 6 2013 2012 170910 1568 106,606 87.846 64,304 68,662 4475 10830 10010 15,305 13421 48,999 1616 136 034 50,155 55,763 13.118 1030 37,037 41,733 6.207 4,099 1,708 171 1238 1.709 (1) 26,842 61,344 3.201 2.123 (133) 55,241 1088 381 (33) 6,895 2061 (431) 53483 13 973 39,510 93 92 24 69 61,089 15.736 48,351 4834 6017 5471 5,753 3.793 4935 3.000 6151 6115 3217 5.252 6066 6.131 SON 5.08 6541 6612 5.500 64 075 001 001 9.27 921 5.72 568 6.09 65 9.25 922 835 831 12.01 1191 072 631 2014 2012 2003 2.35 2005 9.101 Weighted average shares outstanding-batte Weighted average shares outstanding diluted Net eanings (boss) per common shate-bank Net eaming (los) per comma share-diluted Statements of Retained Earnings (in millions of US dollars) Previous retised emings Net.com Cum effect of change in accounting principle Dividends & dividend equivalent rights declared Repurchase of common stock Dividends & dividend equivaleat right declared Retained earnings 2016 92254 15.687 2017 361 48,351 2015 87.152 51.101 2013 10129 37017 100256 39.510 . 411 . 11 2018 9330 59511 278 (11.735) (73055) 1948 70,400 (12.801) (33.001) (881) 98.330 (12.168) (29.600) (119) 96,364 (117) (6.006 16091 92,284 (11.215) (10670 0.333 (3.000) 02950 (199 1410 (16) 87.159101256 101.289 1100 13.815 2.3 Apple Inc.: An Application of Financial Analysis, 2003-2018 Statements of Cash Flow 2018 2017 2016 2015 2014 2013 2012 2008 2003 Statements of Cash Flow fin millions of US dollars) Operating Activities Net income (loss) Depreciation & amortization Share-based compensation expense Deferred income tax expense (benefit) Accounts receivable net Inventories Accounts payable Deferred revenue Net changes in other assets and liabilities Net cash flow from operating activities 59.531 10.903 5,340 (32,590) (5.322) 828 9.175 (40) 29,613 77.434 48,351 10,157 4,840 5.966 (2,093) (2,723) 9,618 (626) 19.892) 63,598 45,687 10,505 4210 4938 1.095 217 1.791 (1,554) (1,065) 65,824 53,394 11.257 3.586 1382 611 (238) 5.400 1012 4,832 81,266 39.510 37,037 41,733 7.916 6,757 3.277 2.863 2.253 1,740 2347 1.141 4405 (4232) 2,172) (5,551) (76) (973) (15) 5938 2340 4467 1,460 1499 2834 3957 5824 2.000 59,713 53,666 50,856 4,834 473 516 (368) (785) (163) 596 5612 1.149) 9.596 09 113 16 (11) (201) (11) 20 71 289 (2618) 3.607 Investing Activities Purchases of securities and long-term investments Proceeds from sales of securities and investments Payments made in connection w business acq.net Payment for acquisition of PPE Payment for acquisition of intangible assets Payments for strategic investments Other cash flow from investing activities Net cash flows from investing activities (71,356) (199,486) (142,428) 103,719 126,339 111.794 (721) (329) (297) (13313) (12,451) (12,734) (344) (814) (1,318) (395) (1,388) (745) 220 (110) 16,066 46446) (45,977) (166,402) (217,128) (148,489) (151.232) 121985 208.111 124,447 112.805 (343) (3,765) (496) (350) (11247) 0,570) (8165) (8.295) (241) (242) (911) (1,107) (23,003) 16243 (220) (1.091) (108) (161) (26) 16 (160) (48) (56,274) (22,579) (33,774) (48,227) (10) (8.189) 333 828 1. Using above information, please prepare common-size balance sheets and income statements for the years 2003 to 2018. What do these summary ratios say about the company in the current year, as well over time? 2. What do you observe about the changes in Apple's performance, liquidity, solvency, and capital structure over the years presented? Use whatever relations and ratios you feel are appropriate for this task. Do your observations fit with what you know about the company's business model and strategy? What surprised you? 3. Please use three ratios from each category (profitability, liquidity & solvency) and justify your analysis 4. Please, use the DuPont analysis of ROE and ROA and provide insight of what this analysis displays. 5. Evaluate the company's current financial performance, liquidity, solvency and capital structure - both for an individual period as well as across time