Question
Application 6. A car dealer kept statistics, for one month, on the annual income of his customers and the price of the car each

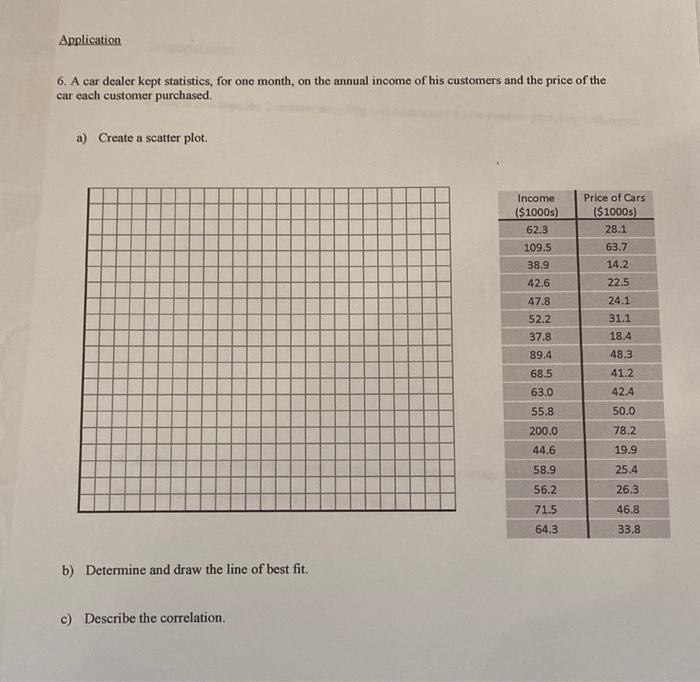
Application 6. A car dealer kept statistics, for one month, on the annual income of his customers and the price of the car each customer purchased. a) Create a scatter plot. Income Price of Cars ($1000s) ($1000s) 62.3 28.1 109.5 63.7 38.9 14.2 42.6 22.5 47.8 24.1 52.2 31.1 37.8 18.4 89.4 48.3 68.5 41.2 63.0 42.4 55.8 50.0 200.0 78.2 44.6 19.9 58.9 25.4 56.2 26.3 71.5 46.8 64.3 33.8 b) Determine and draw the line of best fit. c) Describe the correlation.
Step by Step Solution
3.48 Rating (161 Votes )
There are 3 Steps involved in it
Step: 1

Get Instant Access to Expert-Tailored Solutions
See step-by-step solutions with expert insights and AI powered tools for academic success
Step: 2

Step: 3

Ace Your Homework with AI
Get the answers you need in no time with our AI-driven, step-by-step assistance
Get StartedRecommended Textbook for
Finite Mathematics and Its Applications
Authors: Larry J. Goldstein, David I. Schneider, Martha J. Siegel, Steven Hair
12th edition
978-0134768588, 9780134437767, 134768582, 134437764, 978-0134768632
Students also viewed these Mathematics questions
Question
Answered: 1 week ago
Question
Answered: 1 week ago
Question
Answered: 1 week ago
Question
Answered: 1 week ago
Question
Answered: 1 week ago
Question
Answered: 1 week ago
Question
Answered: 1 week ago
Question
Answered: 1 week ago
Question
Answered: 1 week ago
Question
Answered: 1 week ago
Question
Answered: 1 week ago
Question
Answered: 1 week ago
Question
Answered: 1 week ago
Question
Answered: 1 week ago
Question
Answered: 1 week ago
Question
Answered: 1 week ago
Question
Answered: 1 week ago
Question
Answered: 1 week ago
Question
Answered: 1 week ago
Question
Answered: 1 week ago
Question
Answered: 1 week ago
View Answer in SolutionInn App


