Answered step by step
Verified Expert Solution
Link Copied!

Question

1 Approved Answer

APPLIED NUMERICAL METHOD CODE IN MATLAB SHOW CODE AND OUTPUT 1 Problem 1 Use the interpolation nodes 2k-1 to interpolate f(x) on the interval |-1,1

APPLIED NUMERICAL METHOD CODE IN MATLAB SHOW CODE AND OUTPUT image text in transcribed
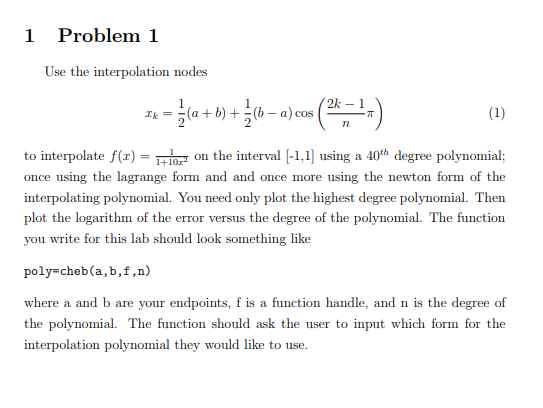
1 Problem 1 Use the interpolation nodes 2k-1 to interpolate f(x) on the interval |-1,1 using a 40th degree polynomial; once using the lagrange form and and once more using the newton form of the interpolating polynomial. You need only plot the highest degree polynomial. Then plot the logarithm of the error versus the degree of the polynomial. The function you write for this lab should look something like poly-cheb(a,b,f,n) t3 where a and b are your endpoints, f is a function handle, and n is the degree of the polynomial. The function should ask the user to input which form for the interpolation polynomial they would like to use. 1 Problem 1 Use the interpolation nodes 2k-1 to interpolate f(x) on the interval |-1,1 using a 40th degree polynomial; once using the lagrange form and and once more using the newton form of the interpolating polynomial. You need only plot the highest degree polynomial. Then plot the logarithm of the error versus the degree of the polynomial. The function you write for this lab should look something like poly-cheb(a,b,f,n) t3 where a and b are your endpoints, f is a function handle, and n is the degree of the polynomial. The function should ask the user to input which form for the interpolation polynomial they would like to use

Step by Step Solution

There are 3 Steps involved in it

Step: 1

blur-text-image

Get Instant Access to Expert-Tailored Solutions

See step-by-step solutions with expert insights and AI powered tools for academic success

Step: 2

blur-text-image

Step: 3

blur-text-image

Ace Your Homework with AI

Get the answers you need in no time with our AI-driven, step-by-step assistance

Get Started

Recommended Textbook for

Database Design Using Entity Relationship Diagrams

Authors: Sikha Saha Bagui, Richard Walsh Earp

3rd Edition

103201718X, 978-1032017181

More Books

Students also viewed these Databases questions

Question

What is the purpose of project crashing analysis?

Answered: 1 week ago

Question

Define and measure service productivity.

Answered: 1 week ago