Applied Statistics
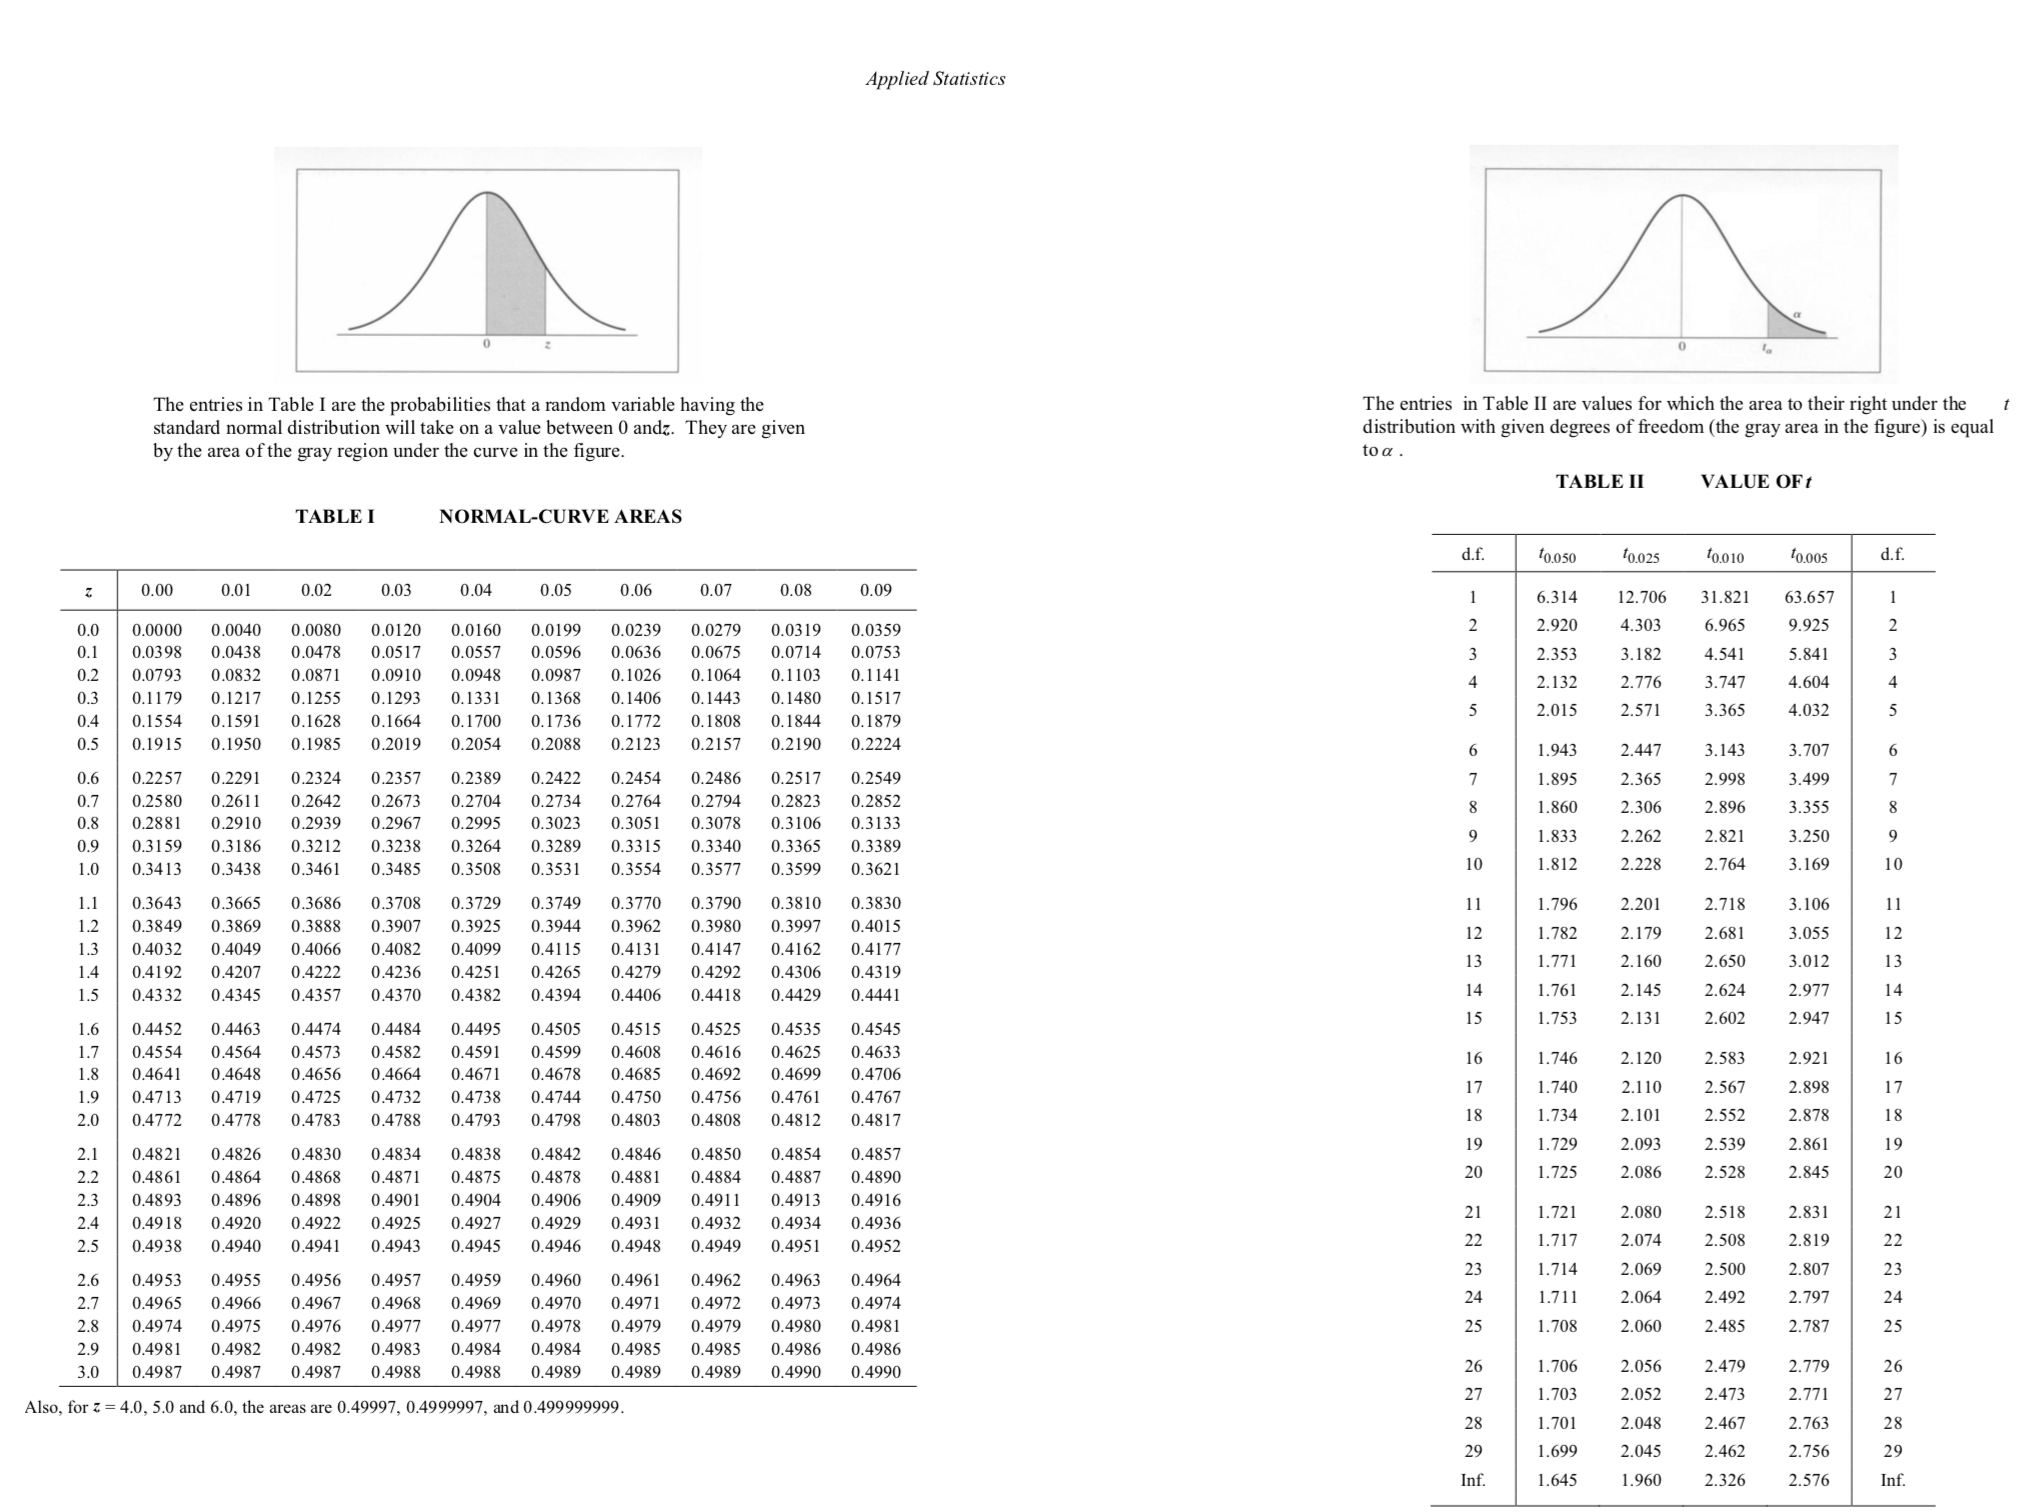
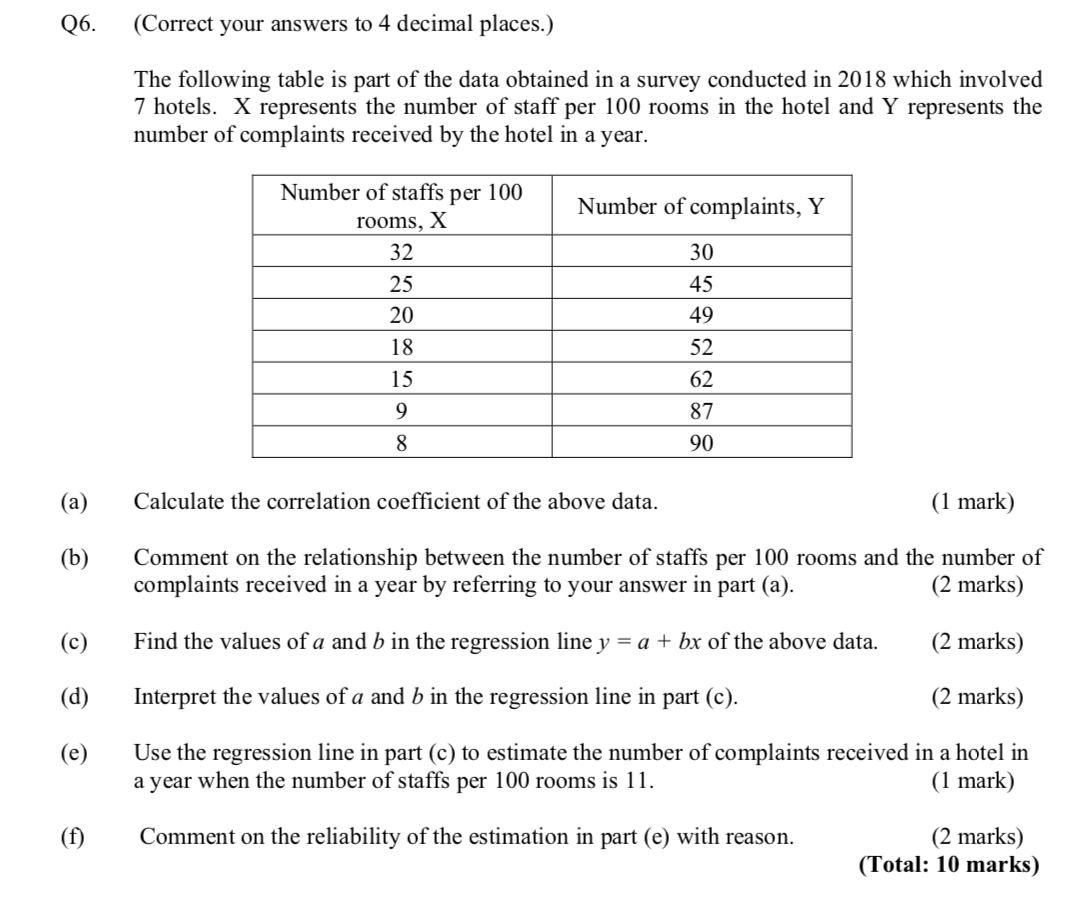
Applied Statistics The entries in Table II are values for which the area to their right under the The entries in Table I are the probabilities that a random variable having the standard normal distribution will take on a value between 0 andz. They are given distribution with given degrees of freedom (the gray area in the figure) is equal by the area of the gray region under the curve in the figure. to a TABLE II TABLE I NORMAL-CURVE AREAS d.f. to.050 to.025 to.010 to.005 d.f. 0.01 0.02 0.03 0.04 0.05 0.06 0.07 0.08 12.706 2.920 4.30 6.965 9.92 0.0 0.0160 0.0239 2.353 3.18 4.541 5.841 0.0398 0.0438 0.0557 4.604 0.2 0.0910 0.0948 .132 2.77 3.747 0.3 0.1179 0.1255 0. 1406 2.015 2.571 3.365 4.032 0.4 0.1554 0.1628 0.1664 0.1700 3.707 0.1915 0.2054 0.2123 1.943 2.44 3.143 0.5 0.1985 0.2088 1.895 2.36 2.99 3.49 0.6 0.2257 0.2291 1.860 2.896 3.355 0.7 0 8 0.2967 0.2995 0.3023 1.833 2.262 2.821 3.250 0.9 0.3159 0.3238 0.3264 0.3289 1.812 2.22 2.764 1.0 0.3413 0.3461 0.3485 0.3508 0.3531 0.3554 1.796 2.20 0.3643 0.3729 0.3749 0.3770 1.2 0.3849 0.3907 0.3925 0.3944 0.3962 0.3980 .782 2.17 2.681 .055 0.4066 0.4099 0.4115 0.4131 1.771 2.16 3.012 1.3 0.4032 1.4 0.4192 0.4207 0.4236 0.4251 0.4265 0.4306 1.761 2.14 2.624 15 0.4332 0.4357 0.4382 0.4406 1.753 2.13 2.602 2.947 15 0.4452 0.4495 0.4515 0.4535 .746 2.583 2.921 1.7 0.4554 0.4573 0.4582 0.4591 0.4599 1.8 0.4641 0.4648 0.4656 0.4678 0.4685 1.740 2.110 2.567 2.898 17 1.9 0.4713 0.4725 0.4732 0.4738 0.4744 0.4750 0.4756 1.734 2.10 2.552 18 2.0 0.4772 0.4783 0.4793 0.4798 0.4803 0.4812 1.729 2.09 2.539 19 2.1 0.4821 0.4830 0.4838 0.4850 0.4854 .725 2.08 2.845 20 0.4864 0.4875 0.4878 0.488 0.4893 0.4896 0.4898 0.4901 0.491 0.4913 1.721 2.518 2.831 21 0.4918 0.4920 0.4922 0.4927 0.4929 0.4931 0.4934 1.717 2.508 0.4938 0.4941 0.4943 0.4945 0.4948 1.714 2.06 2.500 23 2.6 0.4956 0.4957 0.4959 0.4961 0.4963 1.711 2.06 2.492 2.797 2.7 0.4965 0.4967 0.4968 0.4969 0.4970 0.4971 0.4973 0.4980 1.708 2.060 2.485 2.787 25 2.8 0.4974 0.4975 0.4976 0.4978 29 0.4982 0.4983 0.4984 0.4985 1.706 2.05 2.479 2.779 3.0 0.4987 0.4988 0.4988 .4990 0.4990 1.703 2.05 2.473 1.701 2.048 2.467 2.763 1.699 2.04 2.462 2.756 1.645 1.960 2.326Q6. (3) (b) (d) (e) (f) (Correct your answers to 4 decimal places.) The following table is part of the data obtained in a survey conducted in 2013 which involved 7 hotels. X represents the number of staff per 100 rooms in the hotel and Y represents the number of complaints received by the hotel in a year. Number of staffs per 100 Number of complaints, Y rooms, X Calculate the correlation coefcient of the above data. (1 mark) Comment on the relationship between the number of staffs per 100 rooms and the number of complaints received in a year by referring to your answer in part (a). (2 marks) Find the values of a and b in the regression line y = a + bx of the above data. (2 marks) Interpret the values of a and b in the regression line in part (c). (2 marks) Use the regression line in part (c) to estimate the number of complaints received in a hotel in a year when the number of staffs per 100 rooms is 11. (1 mark) Comment on the reliability of the estimation in part (e) with reason. (2 marks) (Total: 10 marks)