Question
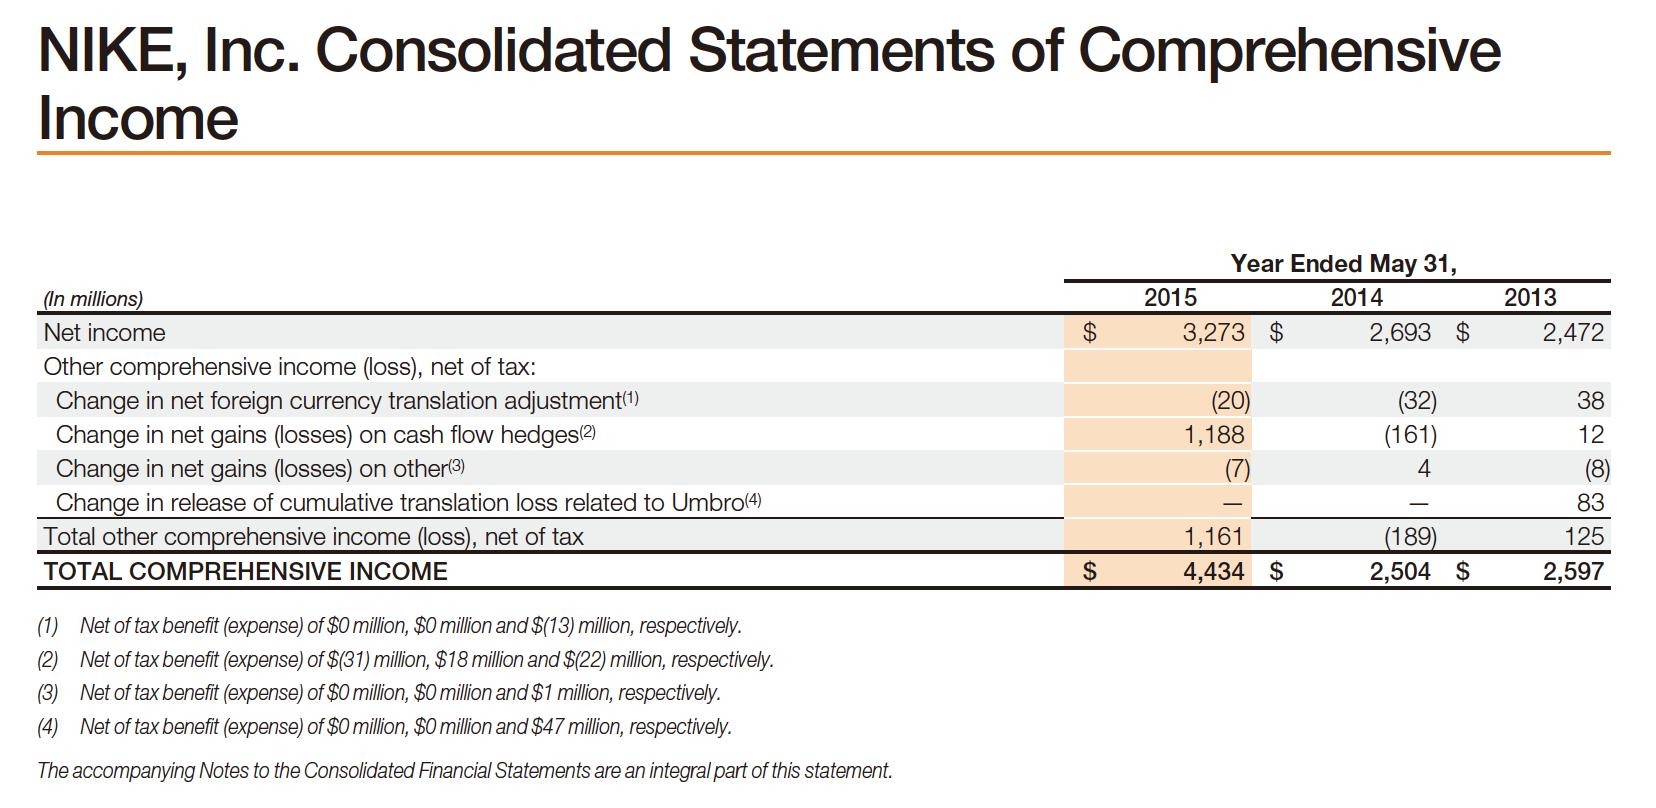
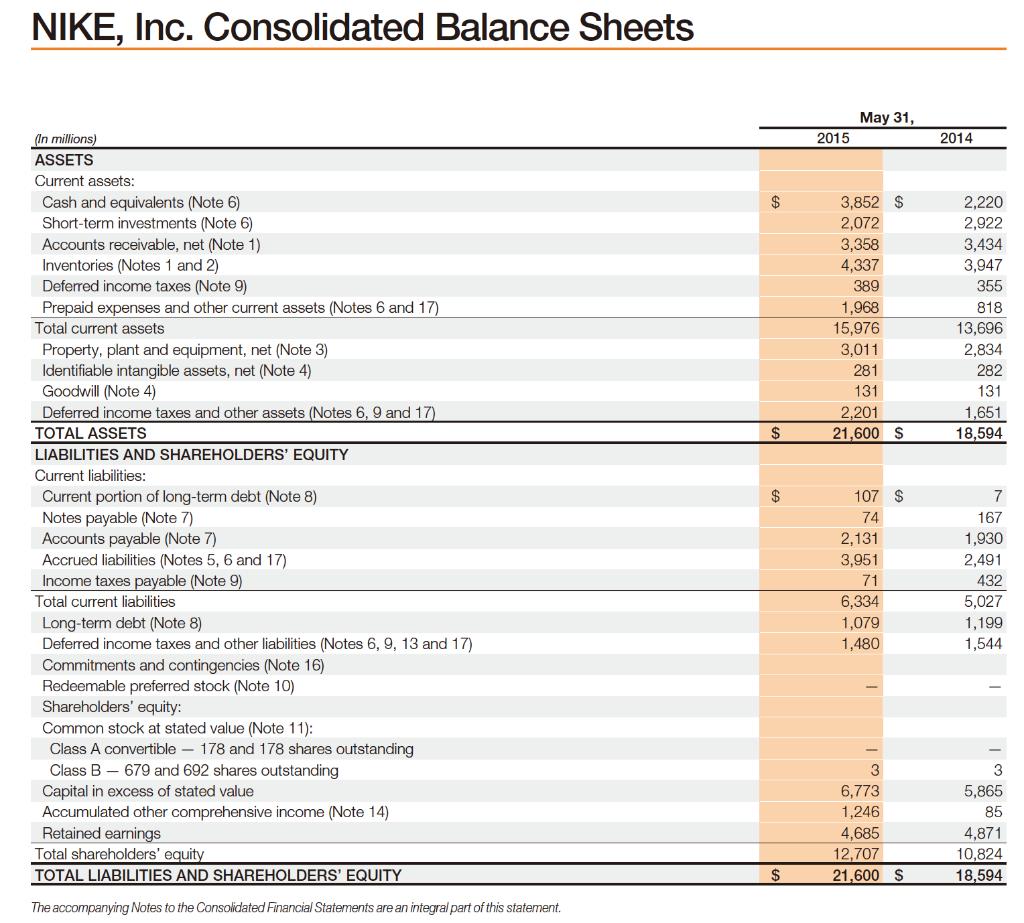
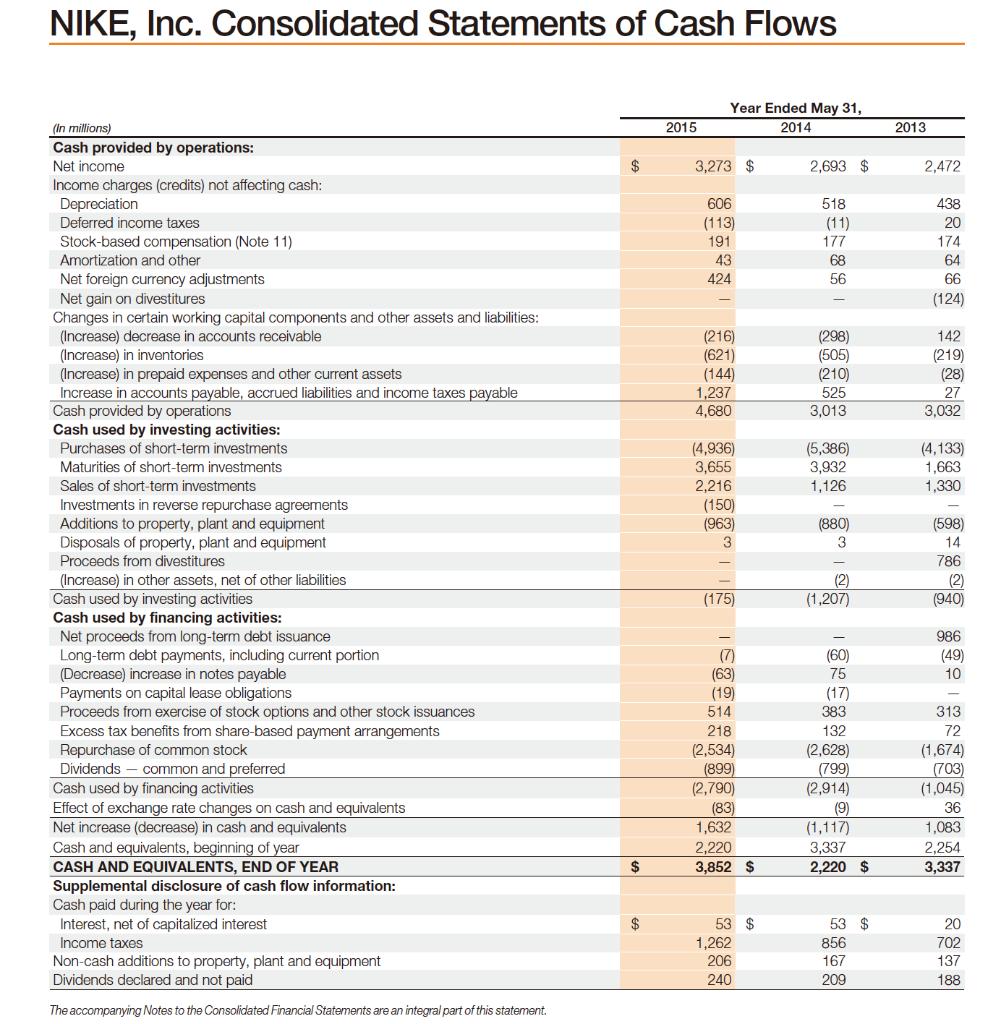
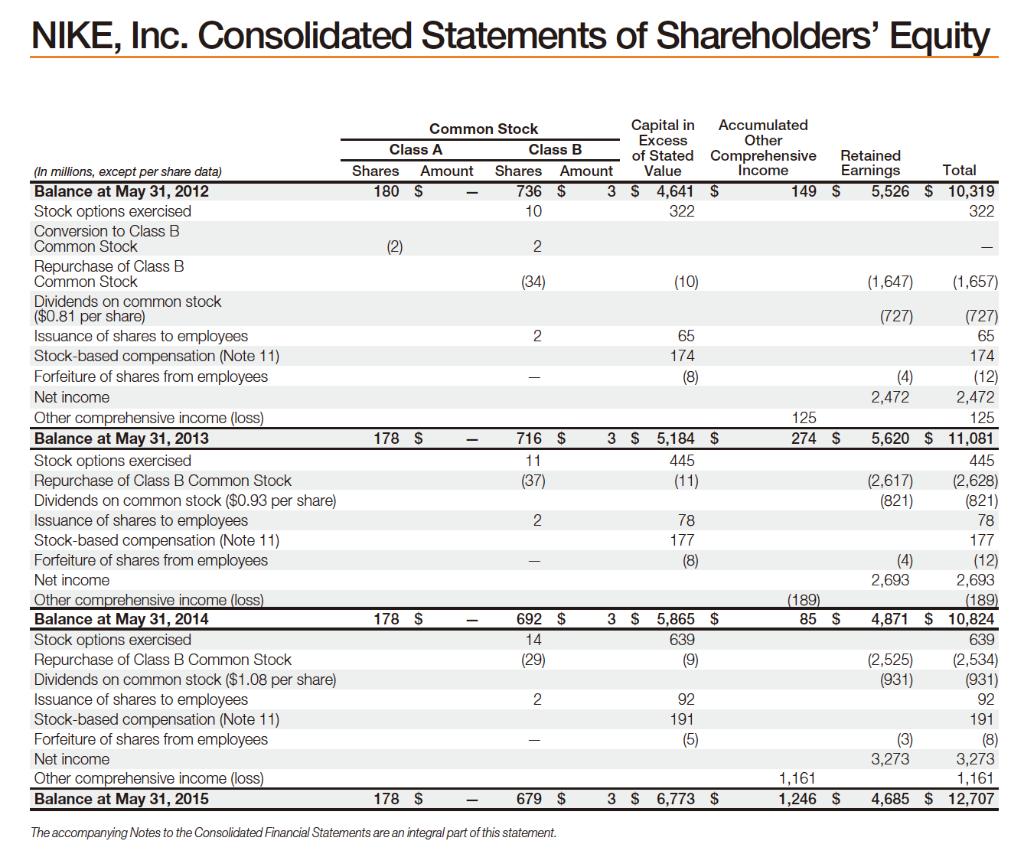
Apply the residual income valuation (RIV) model to calculate the intrinsic price of Nike. The consolidated financial statements for 2014 and 2015 are provided. In
Apply the residual income valuation (RIV) model to calculate the intrinsic price of Nike. The consolidated financial statements for 2014 and 2015 are provided. In addition, the following information and assumptions are provided:
• Nike’s cost of equity capital is 10%.
• As at May 31, 2015, Nike had 855,351,589 common shares outstanding.
• The share price Nike as at May 31, 2015 was $50.94.
• From 2016 to 2020, Nike’s earning per share is expected to grow at 6% on average per annum.
• The Net Dividend Payout ratio (i.e. net dividend paid to shareholders relative to income earned), is projected to be at 0.3 per annum on average from 2016 onwards.
• Assume 1% terminal growth in abnormal earnings.
Required:
You are required to develop an Excel spreadsheet to:
1) Calculate the intrinsic equity price of Nike as at year-end 2015 using the residual income valuation (RIV) model and the information provided above.
2) Calculate by hand the implied growth of abnormal earnings for Nike as at 2010, assuming that all other assumptions are correct. Note that this calculation must be done by hand and show the manual calculation steps in the Word. Then, explain how you can use this knowledge of the implied growth rate for investment decision-making.
3) Using the Goal Seek tool in Excel to calculate the implied expected rate of return, assuming that all other input including the 1% growth in abnormal earnings are correct. Report this calculation in the Word report. Then, explain how you can use this knowledge of the implied expected rate of return for investment decision-making.
4) Describe the appropriateness and the limitations of the RIV model and the assumptions employed in this valuation exercise, specifically within the context of Nike Ltd. Provide arguments that are specifically relevant to Nike Ltd.
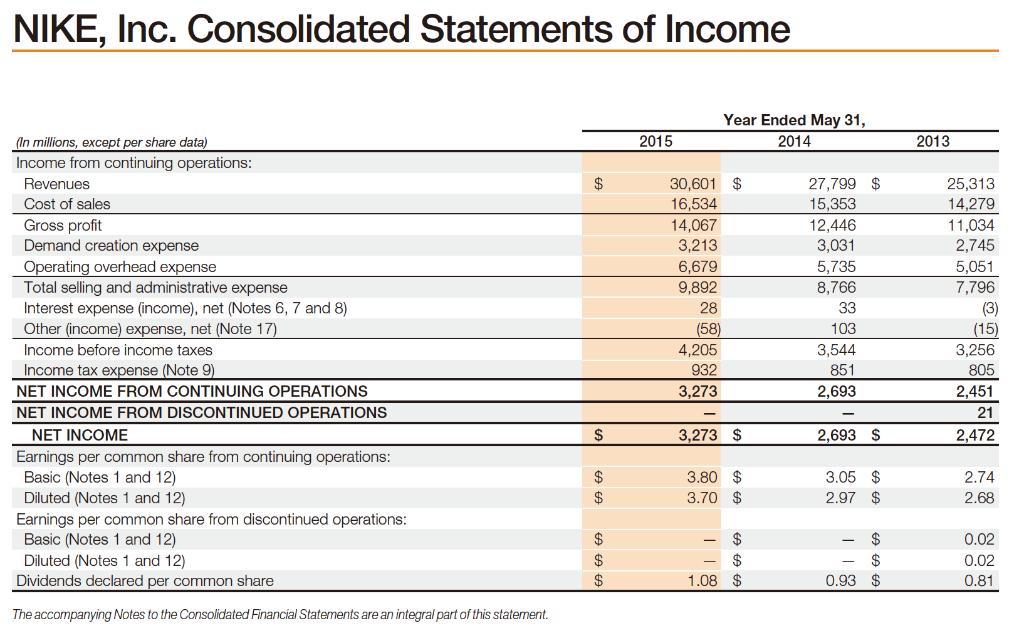
NIKE, Inc. Consolidated Statements of Income (In millions, except per share data) Income from continuing operations: Revenues Cost of sales Gross profit Demand creation expense Operating overhead expense Total selling and administrative expense Interest expense (income), net (Notes 6, 7 and 8) Other (income) expense, net (Note 17) Income before income taxes Income tax expense (Note 9) NET INCOME FROM CONTINUING OPERATIONS NET INCOME FROM DISCONTINUED OPERATIONS NET INCOME Earnings per common share from continuing operations: Basic (Notes 1 and 12) Diluted (Notes 1 and 12) Earnings per common share from discontinued operations: Basic (Notes 1 and 12) Diluted (Notes 1 and 12) Dividends declared per common share The accompanying Notes to the Consolidated Financial Statements are an integral part of this statement. $ $ $ $ $ $ $ 2015 Year Ended May 31, 2014 30,601 $ 16,534 14,067 3,213 6,679 9,892 28 (58) 4,205 932 3,273 3,273 $ 3.80 $ 3.70 $ 69 69 69 1.08 $ 27,799 $ 15,353 12,446 3,031 5,735 8,766 33 103 3,544 851 2,693 2,693 $ 3.05 $ 2.97 6969 $ $ SA GA GA $ 0.93 $ 2013 25,313 14,279 11,034 2,745 5,051 7,796 (3) (15) 3,256 805 2,451 21 2,472 2.74 2.68 0.02 0.02 0.81
Step by Step Solution
3.58 Rating (165 Votes )
There are 3 Steps involved in it
Step: 1
1 Year 2014 2015 Net Income 1869000 2105000 Average Common Equity 12828000 13965000 Cost of Equity 10 Calculation of Average Common Equity 12828000 139650002 13396500 Calculation of Residual Income 21...
Get Instant Access to Expert-Tailored Solutions
See step-by-step solutions with expert insights and AI powered tools for academic success
Step: 2

Step: 3

Ace Your Homework with AI
Get the answers you need in no time with our AI-driven, step-by-step assistance
Get Started


