

Question
Apply the statistical concepts and techniques covered in this week's reading about one-way analysis of variance (ANOVA). An investment analyst is evaluating the 10-year mean
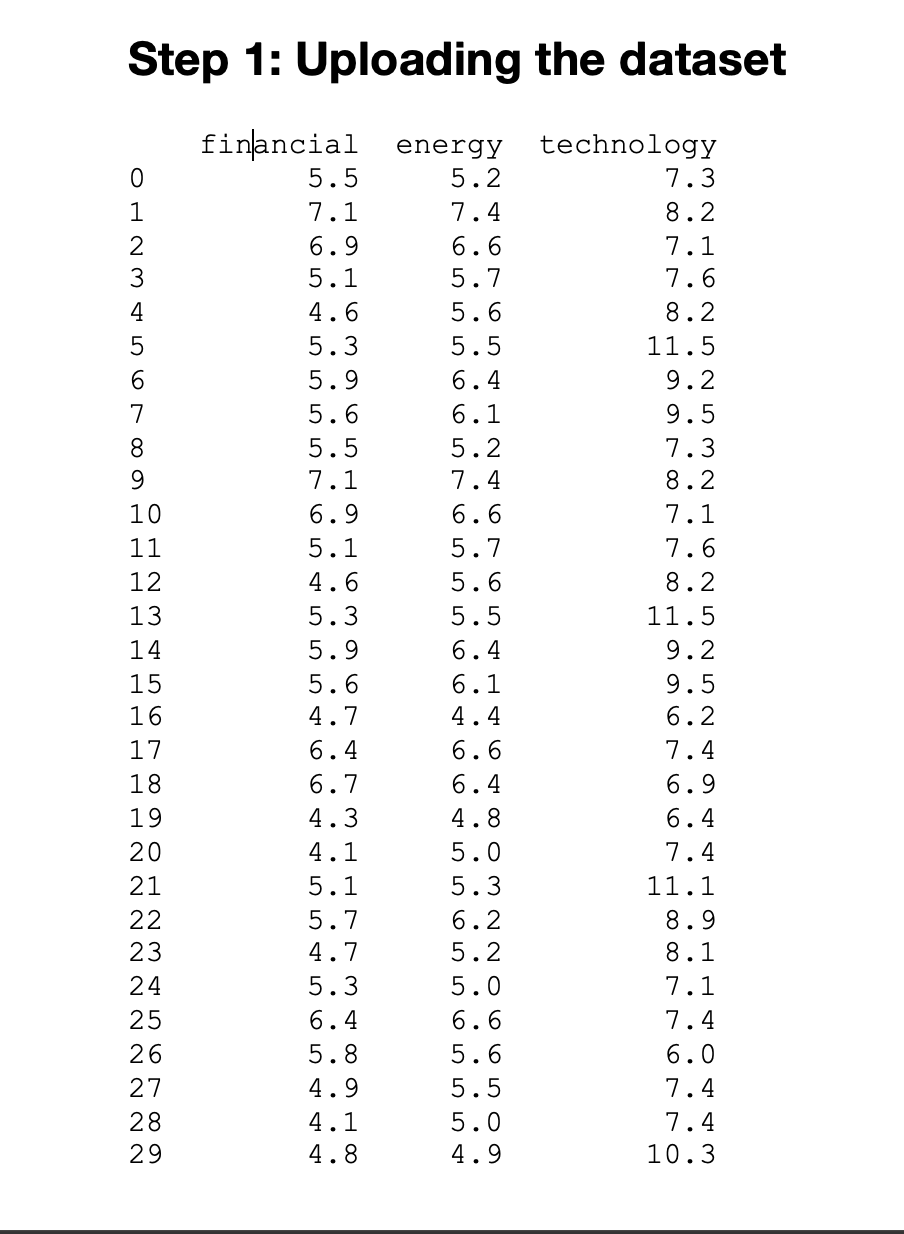
Apply the statistical concepts and techniques covered in this week's reading about one-way analysis of variance (ANOVA). An investment analyst is evaluating the 10-year mean return on investment for industry-specific exchange-traded funds (ETFs) for three sectors: financial, energy, and technology. The analyst obtains a random sample of 30 ETFs for each sector and calculates the 10-year return of each ETF. The analyst has provided you with this data set. Run Step 1 in the Python script to upload the data file.
Using the sample data, perform one-way analysis of variance (ANOVA). Evaluate whether the average return ofat least oneof the industry-specific ETFs is significantly different. Use a 5% level of significance.
In your initial post, address the following items:
- Define the null and alternative hypothesis in mathematical terms and in words.
- Report the level of significance.
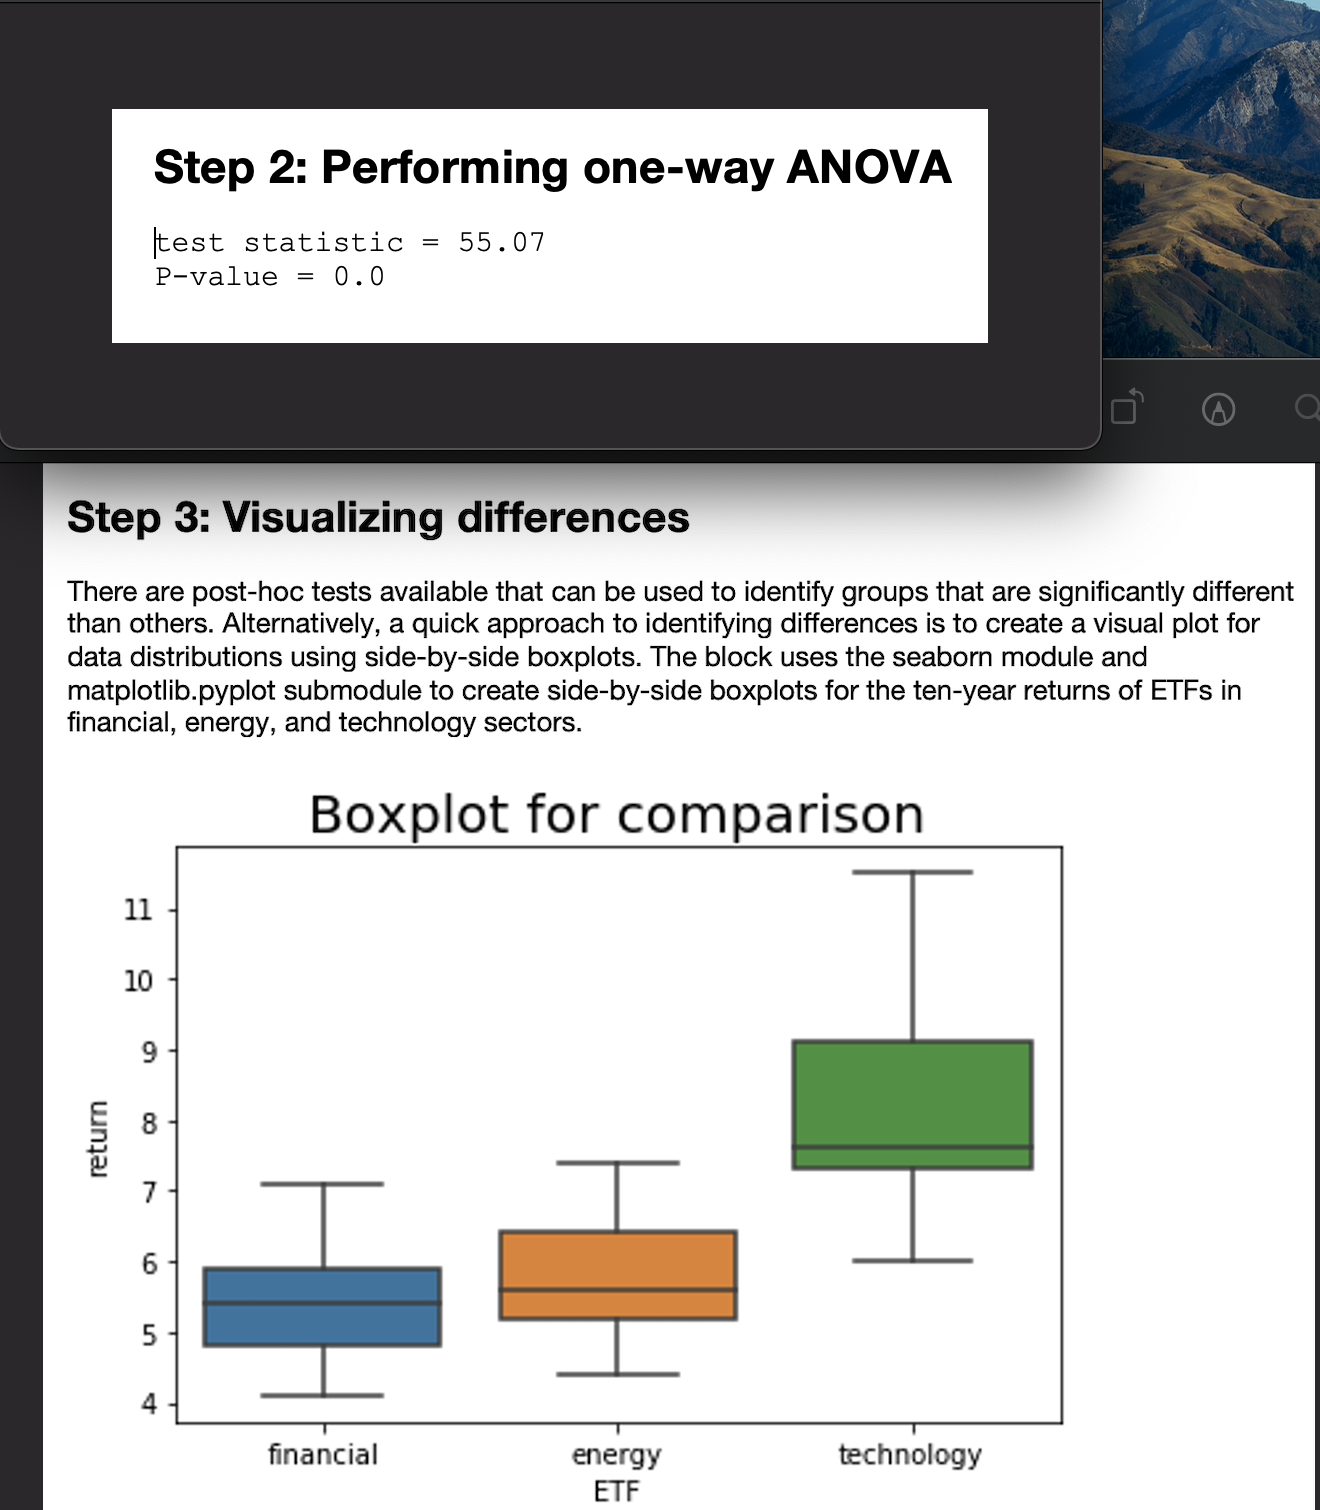
- Include the test statistic and the P-value. See Step 2 in the Python script.
- Provide your conclusion and interpretation of the test. Should the null hypothesis be rejected? Why or why not?
- Does a side-by-side of the 10-year returns of ETFs from the three sectors confirm your conclusion of the hypothesis test? Why or why not? See Step 3 in the Python script.
Step by Step Solution
There are 3 Steps involved in it
Step: 1

Get Instant Access to Expert-Tailored Solutions
See step-by-step solutions with expert insights and AI powered tools for academic success
Step: 2

Step: 3
Ace Your Homework with AI
Get the answers you need in no time with our AI-driven, step-by-step assistance
Get Started
Algebra And Trigonometry
Authors: Cynthia Y Young
5th Edition
1119820898, 9781119820895