Answered step by step
Verified Expert Solution
Question
1 Approved Answer
1. Collect two data set consists quantitative (one discrete and one continuous variable) [mention the measurement unite of the continuous variable] 2. Apply the

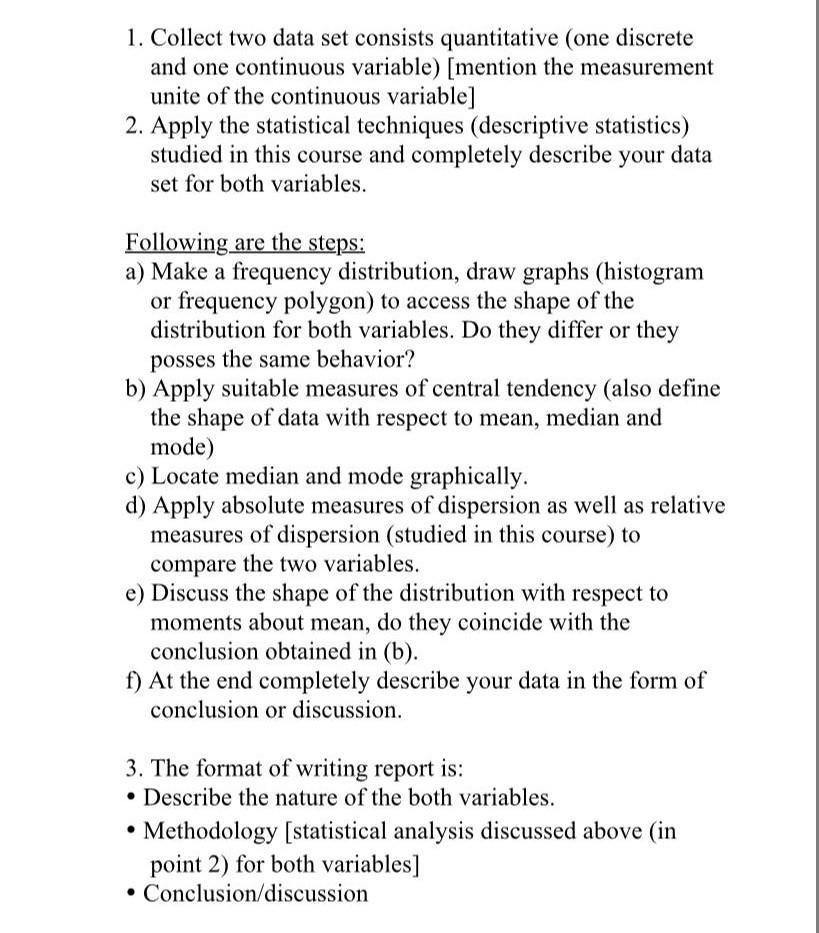
1. Collect two data set consists quantitative (one discrete and one continuous variable) [mention the measurement unite of the continuous variable] 2. Apply the statistical techniques (descriptive statistics) studied in this course and completely describe your data set for both variables. Following are the steps: a) Make a frequency distribution, draw graphs (histogram or frequency polygon) to access the shape of the distribution for both variables. Do they differ or they posses the same behavior? b) Apply suitable measures of central tendency (also define the shape of data with respect to mean, median and mode) c) Locate median and mode graphically. d) Apply absolute measures of dispersion as well as relative measures of dispersion (studied in this course) to compare the two variables. e) Discuss the shape of the distribution with respect to moments about mean, do they coincide with the conclusion obtained in (b). f) At the end completely describe your data in the form of conclusion or discussion. 3. The format of writing report is: Describe the nature of the both variables. Methodology [statistical analysis discussed above (in point 2) for both variables] Conclusion/discussion
Step by Step Solution
★★★★★
3.52 Rating (166 Votes )
There are 3 Steps involved in it
Step: 1
measures of central tendency a...
Get Instant Access to Expert-Tailored Solutions
See step-by-step solutions with expert insights and AI powered tools for academic success
Step: 2

Step: 3

Ace Your Homework with AI
Get the answers you need in no time with our AI-driven, step-by-step assistance
Get Started


