Question
Applying Statistical Analysis in a Six Sigma Project at GE Fanuc4 GE Fanuc Automation (now GE Intelligent Platforms) in Charlottesville, Virginia, was a joint venture
Applying Statistical Analysis in a Six Sigma Project at GE Fanuc4
GE Fanuc Automation (now GE Intelligent Platforms) in Charlottesville, Virginia, was a joint venture (since dissolved) between General Electric and Fanuc Ltd. of Japan, a company that specializes in computer numerical control (CNC) and robotic technology. At the time of this case, the division had annual sales of about $700 million from the manufacture and sale of factory automation products for the automotive, food processing and packaging, paper, pharmaceutical, robotics, chemical, and energy industries. The headquarters and main manufacturing plant is at the Charlottesville facility, which is composed of more than 500,000 square feet of floor space divided among seven buildings on 50 acres of land. GE Fanuc implemented their Six Sigma program in 1996, shortly after Jack Welch announced the quality initiative for the entire company.
In mid-2002, a team at the GE Fanuc manufacturing plant in Charlottesville, led by Six Sigma black belt Donald Splaun, was given the go-ahead to investigate Black Belt Project #P52320. The objective of the project was to evaluate Printed Wire Board (PWB) Fabricated Board Finishes to determine if the high-priced nickel-gold (Ni-Au) finished boards that were being used were necessary as mounting platforms for fine pitch surface-mounted devices (SMDs) or for fine pitched Ball Grid Array (BGA) electronic controller boards. SMDs are electronic components, such as microprocessors, that are placed on the top of electronic circuit boards (fabricated boards) and then their electrical wire leads are soldered into place. Fine pitch SMDs don’t have much space between electrical wire leads, making it difficult to put just the right amount of solder on them to make the proper electrical connection to the circuit boards on which they are mounted. The completed boards with all components properly mounted on them are then used in electrical assemblies to control the operations of industrial machinery.
Splaun had seven people on his analysis team, plus a financial representative to verify the dollar costs and savings; a master black belt reviewer, who would evaluate the project to prevent obvious gaps in the analysis; and perhaps most importantly from a managerial standpoint, a champion/sponsor, who would ensure project visibility and that resources were allocated to complete the project. Team members and their job functions were:
• Team leader and black belt
• Process engineer and fabricated board expert
• Advanced manufacturing engineer responsible for SMD board assembly
• Sourcing agent who purchases the boards
• Test engineer who tests and evaluates the boards
• Producibility engineer who works with design teams
• Production line operator who runs boards
• Supplier quality analysis technician responsible for incoming board quality
Outside resources included:
• Financial representative to assist in cost calculations
• Champion/Sponsor
• Reviewer and master black belt
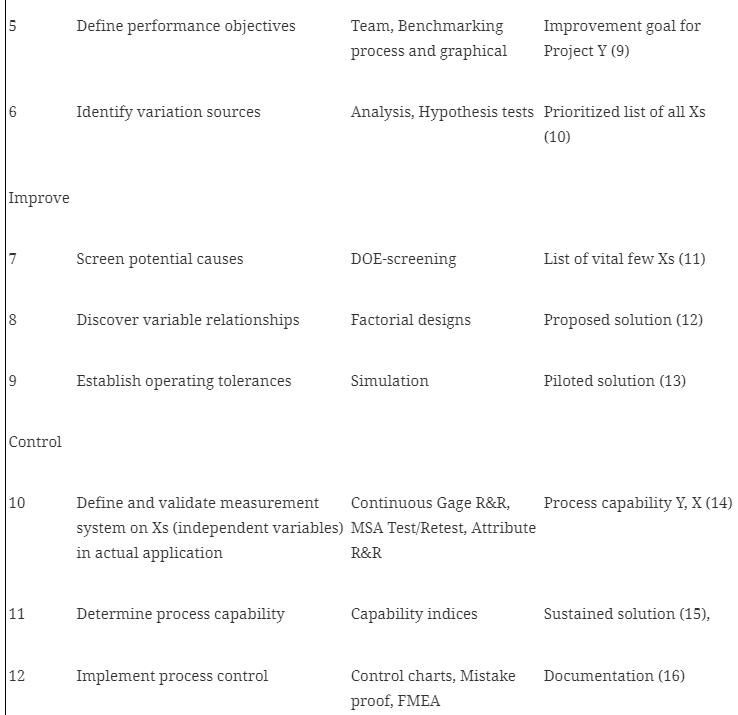
The team used a 12-step DMAIC process developed by GE Fanuc to guide them through the project (see Table 5.1). The first three pre-project definition substeps (A, B, and C) required them to identify project CTQs, develop a team charter and have it approved, and define a process map.

Project team members identified the CTQs by using a standard cause-and-effect matrix and weighted rankings of CTQ factors to prioritize them. The team determined there were three CTQs, two of which were business factors and one of which was a project factor:
• Business CTQ factors: Variable cost productivity (VCP) improvement, composed of the CTQs of internal cost reduction and contribution margin improvement
• Project CTQ factor: Benefits associated with additional Ni-Au cost of $190,000 per year, suspected to be unnecessary
The team developed their charter to define the problem and working relationships. The problem clearly and succinctly was stated as:
GE Fanuc currently specifies Ni-Au on fine pitch SMD and BGA boards. The purpose of this project is to evaluate if this specification is necessary.
The team also identified tools and databases to be used in the study, not only to ensure that everyone was working from a common source, but also to take advantage of the training that had been provided to team members. The tools included two statistical/spreadsheet software packages (Minitab and Excel) and a plantwide integrated database (SAP) that contained information on board characteristics, usage, specifications, costs, and so on.
Based on a 29-step process flowchart, it was decided that the analysis would require a moderately complex experimental design. This design was required to determine the effects of supplier differences and finishes because relatively few defects were being observed in manufacturing the boards. Data would have to be gathered from the experiment and from supplier surveys to help the team track potential causes that could have a bearing on the functionality and cost of each of the alternative boards or board materials being considered.
The experiment was designed to sample and test 288 CX3A1 boards:
• 96 hot air solder leveled (HASL) boards, 32 from each supplier
• 96 nickel-gold (Ni-Au) boards, 32 from each supplier
• 96 silver (Ag) boards, 32 from each supplier and to evaluate three suppliers
The three suppliers were:
• Vendor G, Singapore/China (one or two GE Fanuc production suppliers)
• Vendor P, Taiwan/China (second major GE Fanuc supplier)
• Vendor D, USA (current prototype/fast turn supplier)
The cause-and-effect matrix identified 13 characteristics (Xs, or independent variables) that were considered important to measure during the experiment for each of the three finish types (Ys, or dependent variables). The primary hypothesis was that no significant differences in numbers of defects would be incurred, regardless of finish. In addition, a hypothesis that no significant interaction effects existed between suppliers, coatings, and any of the 13 characteristics considered essential for quality board functioning was investigated. The data collection and analysis process consisted of eight carefully defined steps conducted over a six-day period, involving almost $37,500 worth of boards and hard-to-measure production delays while the test boards were run on what are normally high speed, highly automated production machines.
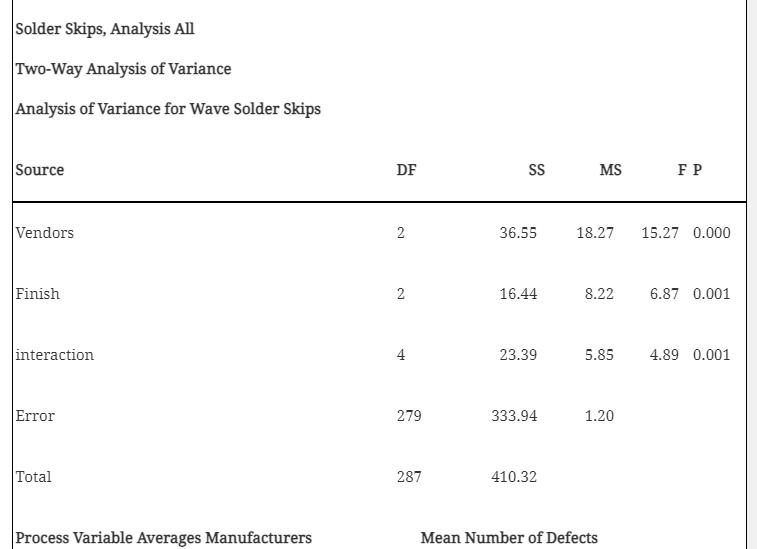
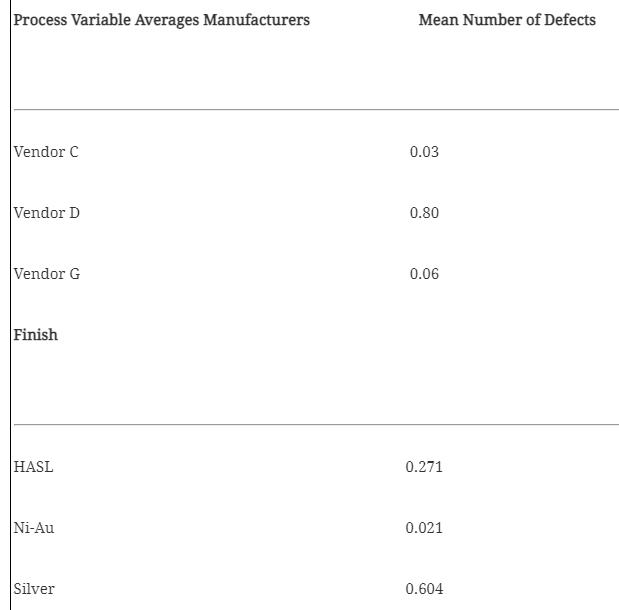
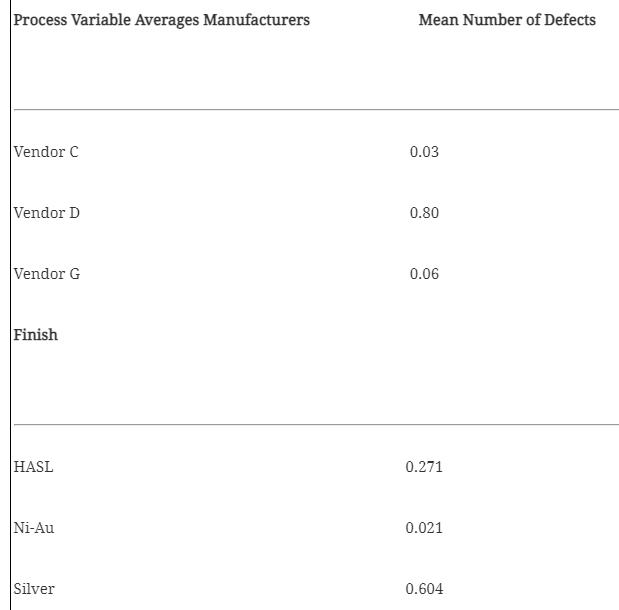
After the data were collected, numerous ANOVA computer runs were made to pinpoint problem areas and test hypotheses. It was especially important to test the capabilities of each of the three types of board finishes to determine whether they were equivalent to the current, and very expensive, Ni-Au finished boards. It was also necessary to get some data to prove or disprove hypotheses about supplier capabilities as well. Table 5.2 shows a typical computer printout and analysis of one of the 13 variables that was tested, called “Wave Solder Skips.”


- In the GE-Fanuc case, why did the experimental design have to be so complex? Why were so many individuals involved in this project?
- What might have been some contributing factors that caused GE-Fanuc to select the Ni-Au over the cheaper boards in the past?
- From Table 5.2 in the case study, what can you conclude, given the F values and the p-values in the table? What steps should the team take, regarding use of vendors and further testing for this particular independent variable?
5 S Improve 8 60 Control 10 11 12 Define performance objectives Identify variation sources Screen potential causes Discover variable relationships Establish operating tolerances Determine process capability Team, Benchmarking process and graphical Implement process control Analysis, Hypothesis tests Prioritized list of all Xs (10) DOE-screening Factorial designs Define and validate measurement Continuous Gage R&R, system on Xs (independent variables) MSA Test/Retest, Attribute in actual application R&R Simulation Capability indices Improvement goal for Project Y (9) Control charts, Mistake proof, FMEA List of vital few Xs (11) Proposed solution (12) Piloted solution (13) Process capability Y, X (14) Sustained solution (15), Documentation (16)
Step by Step Solution
There are 3 Steps involved in it
Step: 1
1 In the GEFanuc case the experimental design had to be complex because the project aimed to evaluate highly specific and technical characteristics of printed wire board PWB finishes to determine thei...
Get Instant Access to Expert-Tailored Solutions
See step-by-step solutions with expert insights and AI powered tools for academic success
Step: 2

Step: 3

Ace Your Homework with AI
Get the answers you need in no time with our AI-driven, step-by-step assistance
Get Started


