Question
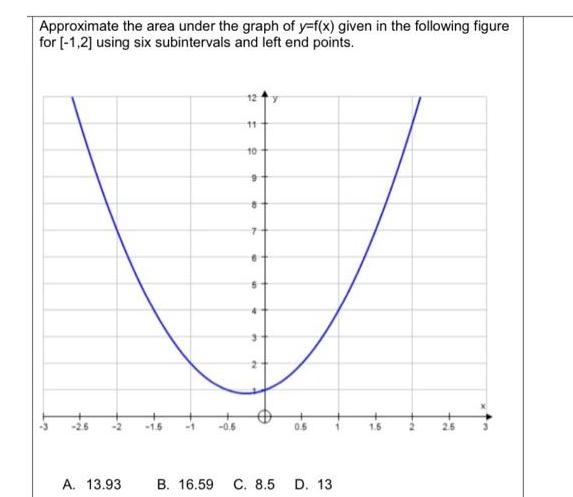
Approximate the area under the graph of y=f(x) given in the following figure for [-1,2] using six subintervals and left end points. -2 A.

Approximate the area under the graph of y=f(x) given in the following figure for [-1,2] using six subintervals and left end points. -2 A. 13.93 -1.5 -1 12 y 11 10 9 8 7 5 B. 16.59 C. 8.5 D. 13 1.6 2
Step by Step Solution
3.34 Rating (151 Votes )
There are 3 Steps involved in it
Step: 1
The detailed answer for the above question is provided below Here the ...
Get Instant Access to Expert-Tailored Solutions
See step-by-step solutions with expert insights and AI powered tools for academic success
Step: 2

Step: 3

Ace Your Homework with AI
Get the answers you need in no time with our AI-driven, step-by-step assistance
Get StartedRecommended Textbook for
Calculus Graphical, Numerical, Algebraic
Authors: Ross L. Finney, Franklin D. Demana, Bert K. Waits, Daniel Kennedy
3rd Edition
0132014084, 978-0132014083
Students also viewed these Accounting questions
Question
Answered: 1 week ago
Question
Answered: 1 week ago
Question
Answered: 1 week ago
Question
Answered: 1 week ago
Question
Answered: 1 week ago
Question
Answered: 1 week ago
Question
Answered: 1 week ago
Question
Answered: 1 week ago
Question
Answered: 1 week ago
Question
Answered: 1 week ago
Question
Answered: 1 week ago
Question
Answered: 1 week ago
Question
Answered: 1 week ago
Question
Answered: 1 week ago
Question
Answered: 1 week ago
Question
Answered: 1 week ago
Question
Answered: 1 week ago
Question
Answered: 1 week ago
Question
Answered: 1 week ago
Question
Answered: 1 week ago
Question
Answered: 1 week ago
Question
Answered: 1 week ago
View Answer in SolutionInn App


