Approximation and distribution
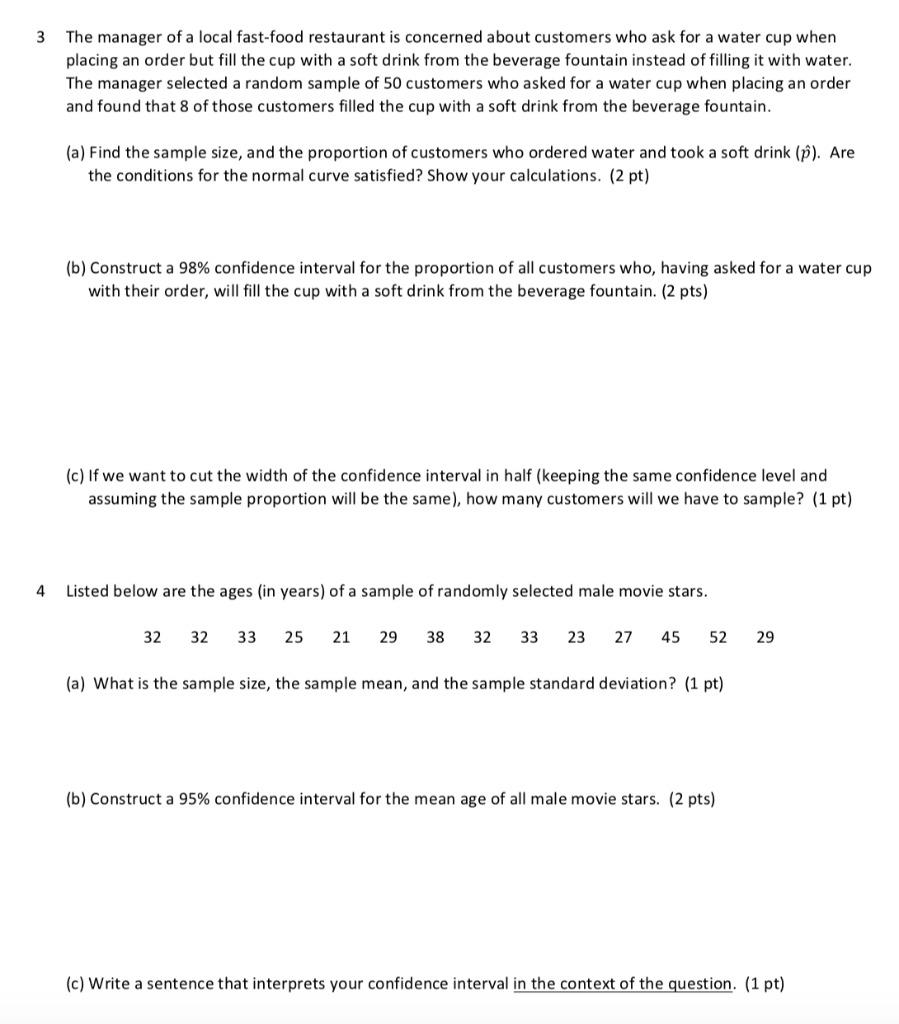
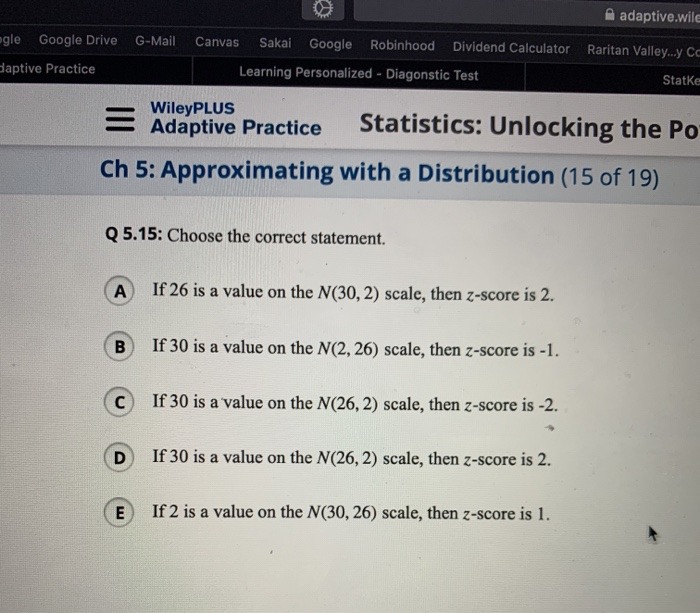
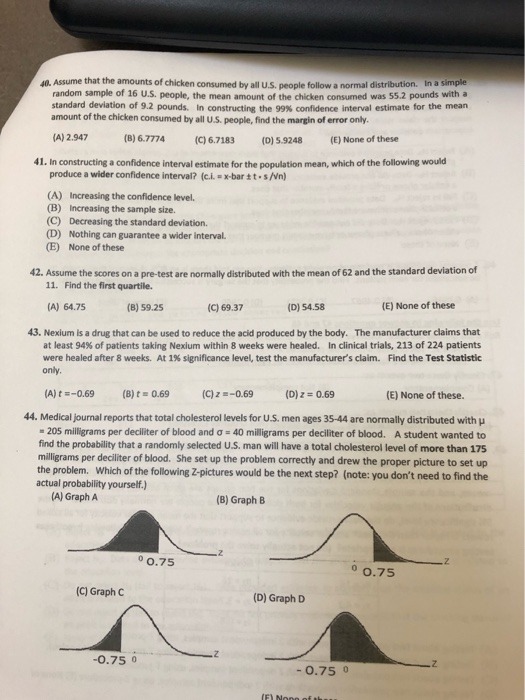
3 The manager of a local fast-food restaurant is concerned about customers who ask for a water cup when placing an order but fill the cup with a soft drink from the beverage fountain instead of filling it with water. The manager selected a random sample of 50 customers who asked for a water cup when placing an order and found that 8 of those customers filled the cup with a soft drink from the beverage fountain. (a) Find the sample size, and the proportion of customers who ordered water and took a soft drink (p). Are the conditions for the normal curve satisfied? Show your calculations. (2 pt) (b) Construct a 98% confidence interval for the proportion of all customers who, having asked for a water cup with their order, will fill the cup with a soft drink from the beverage fountain. (2 pts) (c) If we want to cut the width of the confidence interval in half (keeping the same confidence level and assuming the sample proportion will be the same), how many customers will we have to sample? (1 pt) 4 Listed below are the ages (in years) of a sample of randomly selected male movie stars. 32 32 25 29 38 32 33 23 27 45 52 29 (a) What is the sample size, the sample mean, and the sample standard deviation? (1 pt) (b) Construct a 95% confidence interval for the mean age of all male movie stars. (2 pts) (c) Write a sentence that interprets your confidence interval in the context of the question. (1 pt)A adaptive.wile gle Google Drive G-Mail Canvas Sakai Google Robinhood Dividend Calculator Raritan Valley...y C daptive Practice Learning Personalized - Diagonstic Test StatKe E WileyPLUS Adaptive Practice Statistics: Unlocking the Po Ch 5: Approximationg with a Distribution (15 of 19) Q 5.15: Choose the correct statement. A If 26 is a value on the N(30, 2) scale, then z-score is 2. B If 30 is a value on the N(2, 26) scale, then z-score is -1. C) If 30 is a value on the N(26, 2) scale, then z-score is -2. D) If 30 is a value on the N(26, 2) scale, then z-score is 2. E) If 2 is a value on the N(30, 26) scale, then z-score is 1.to Assume that the amounts of chicken consumed by all U.S. people follow a normal distribution. In a simple random sample of 16 U.S. people, the mean amount of the chicken consumed was 55.2 pounds with a standard deviation of 9.2 pounds. In constructing the 99% confidence Interval estimate for the mean amount of the chicken consumed by all U.5. people, find the margin of error only. (A) 2.947 (B) 6.7774 (C) 6.7183 (D) 5.9248 (E) None of these 41. In constructing a confidence interval estimate for the population mean, which of the following would produce a wider confidence interval? (c.i. = x-bar # t . s/Vn) (A) Increasing the confidence level. (B) Increasing the sample size. (C) Decreasing the standard deviation. (D) Nothing can guarantee a wider Interval. (E) None of these 42. Assume the scores on a pre-test are normally distributed with the mean of 62 and the standard deviation of 11. Find the first quartile. (A) 64.75 (B) 59.25 (C) 69.37 (D) 54.58 [E) None of these 43. Nexium is a drug that can be used to reduce the acid produced by the body. The manufacturer claims that at least 94%% of patients taking Nexium within 8 weeks were healed. In clinical trials, 213 of 224 patients were healed after 8 weeks. At 1%% significance level, test the manufacturer's claim. Find the Test Statistic only. (A) t =-0.69 (B) t = 0.69 (C) z =-0.69 (D) z = 0.69 (E) None of these. 44. Medical journal reports that total cholesterol levels for U.5. men ages 35-44 are normally distributed with - 205 milligrams per deciliter of blood and o = 40 milligrams per deciliter of blood. A student wanted to find the probability that a randomly selected U.5. man will have a total cholesterol level of more than 175 milligrams per deciliter of blood. She set up the problem correctly and drew the proper picture to set up the problem. Which of the following Z-pictures would be the next step? (note: you don't need to find the actual probability yourself.} (A) Graph A (B) Graph B 0 0.75 .Z 0 0.75 (C] Graph C (D) Graph D -0.75 0 - 0.75 0


