Answered step by step
Verified Expert Solution
Question
1 Approved Answer
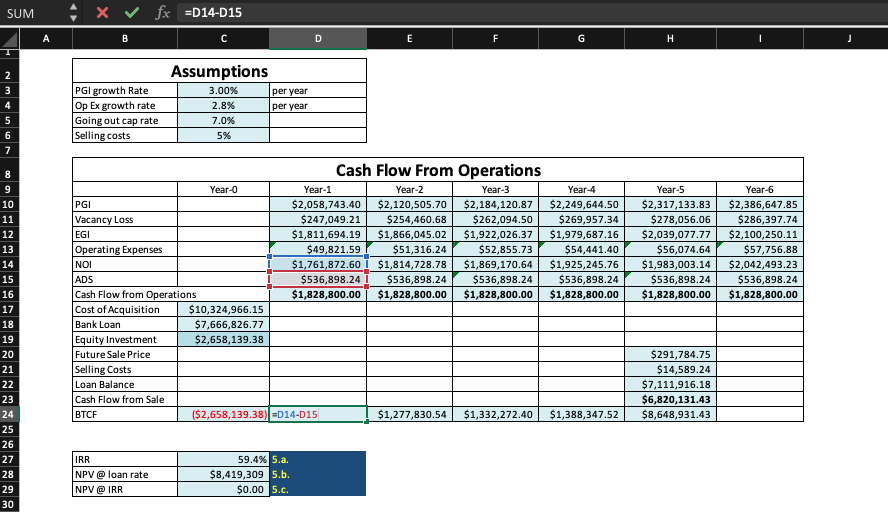
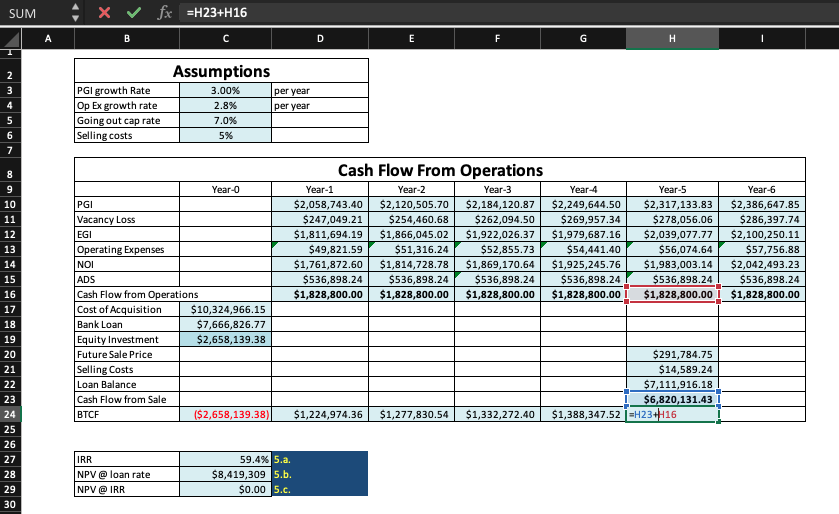
Are my IRR, NPV@ loan rate, NPV@ IRR, and BTCF formulas correct? Ive screenshotted my spreadsheets showing each formula used, can someone tell me if
Are my IRR, NPV@ loan rate, NPV@ IRR, and BTCF formulas correct?
Ive screenshotted my spreadsheets showing each formula used, can someone tell me if these look correct?
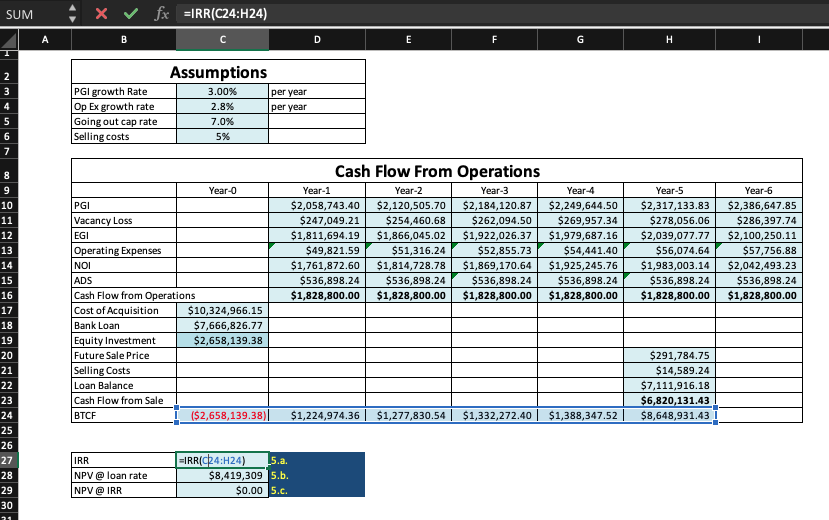
Info from IRR:
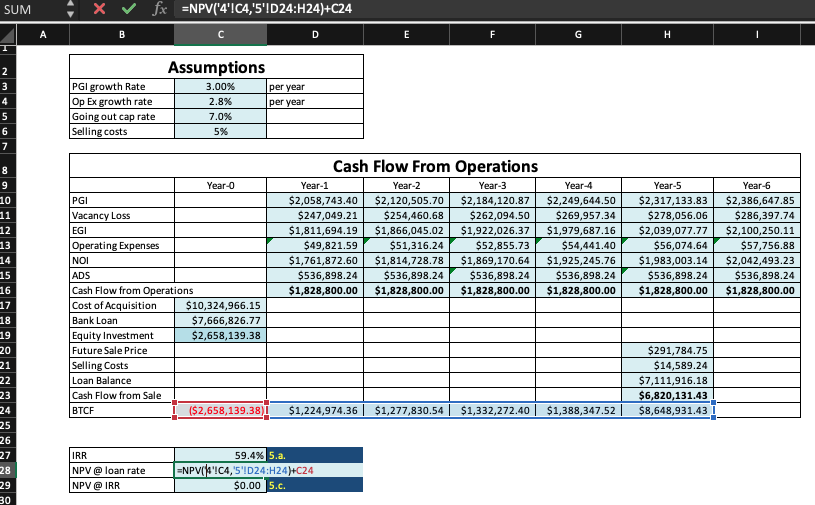
NPV@ loan rate:
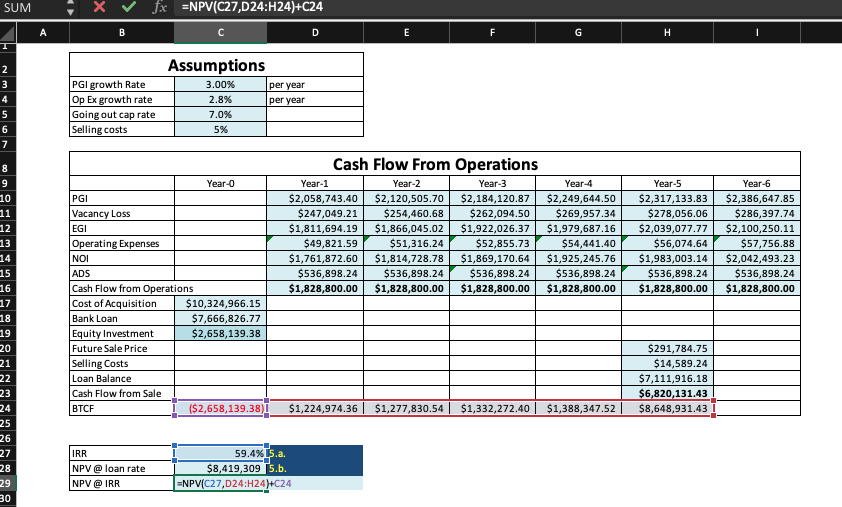
NPV@ IRR:
BTCF Year 1-4 ( The BTCF I used for year 1-4 are all subtracting NOI and ADS):
BTCF @ year of sale:
SUM , X fx EIRR(C24:H24) Assumptions per year per year PGI growth Rate - Op Ex growth rate Going out cap rate Selling costs 3.00% 3.00% 2.8% 7.0% 5% Year-0 PGI Cash Flow From Operations Year-1 Year-2 Year-3 $2,058,743.40 $2,120,505.70 $2,184,120.87 $247,049.21 $247 099 2112 $254,460.68 AGO CO A FO $262,094.50 $1,811,694.19 $1,866,045.02 $1,922,026.37 $49,821.59 $51,316.24 $52,855.73 $1,761,872.60 $1,814,728.78 $1,869,170.64 $536,898.24 $536,898.24 $536,898.24 $1,828,800.00 $1,828,800.00 $1,828,800.00 Year 4 $2,249,644.50 $269,957.34 $1,979,687.16 $54,441.40 $1,925,245.76 $536,898.24 $1,828,800.00 Year-5 $2,317,133.83 $278,056.06 $2,039,077.77 $56,074.64 $1,983,003.14 $536,898.24 $1,828,800.00 Year-6 $2,386,647.85 $286,397.74 $2,100,250.11 $57,756.88 $2,042,493.23 $536,898.24 $1,828,800.00 Vacancy Loss EGI Operating Expenses NOI ADS Cash Flow from Operations Cost of Acquisition $10,324,966.15 Bank Loan $7,666,826.77 Equity Investment $2,658,139.38 Future Sale Price Selling Costs Loan Balance Cash Flow from Sale ! BTCF ($2,658,139.38)| $291,784.75 $14,589.24 $7,111,916.18 $6,820,131.43 $8,648,931.43 | $1,224,974.36 $1,277,830.54 $1,332,272.40 $1,388,347.52 1 EIRR(C4:H24) _5.a. Mpv @ loan rate IRR NPV @loan rate NPV @IRR $8,419,309 5.b. $0.00 5.c. SUM - x fx =NPV('4'IC4,'5'ID24:H24)+C24 A PGI growth Rate Op Ex growth rate Going out cap rate Selling costs Assumptions 3.00% per year 2.8% per year 7.0% 5% PGI Cash Flow From Operations Year-1 Year-2 Year-3 $2,058,743.40 $2,120,505.70 $2,184,120.87 $247,049.21 $254,460.68 $262,094.50 $1,811,694.19 $1,866,045.02 $1,922,026.37 $49,821.59 $51,316.24 $52,855.73 $1,761,872.60 $1,814,728.78 $1,869, 170.64 $536,898.24 $536,898.24 $536,898.24 $1,828,800.00 $1,828,800.00 $1,828,800.00 Year 4 $2,249,644.50 $269,957.34 $1,979,687.16 $54,441.40 $1,925,245.76 $536,898.24 $1,828,800.00 Year-5 $2,317,133.83 $278,056.06 $2,039,077.77 $56,074.64 $1,983,003.14 $536,898.24 $1,828,800.00 Year-6 $2,386,647.85 $286,397.74 $2,100,250.11 $57,756.88 $2,042,493.23 $536,898.24 $1,828,800.00 Year-0 I Vacancy Loss EGI Operating Expenses NOI ADS Cash Flow from Operations Cost of Acquisition $10,324,966.15 Bank Loan $7,666,826.77 Equity Investment $2,658, 139.38 Future Sale Price Selling Costs Loan Balance Cash Flow from Sale | BTCF ($2,658,139.38)| $291.784.75 $14,589.24 $7,111,916.18 $6,820,131.43 $8,648,931.43 $1,224,974.36 $1,277,830.54 $1,332,272.40 $1,388,347.52 | IRR NPV @loan rate NPV@IRR 59.496 5.a. | ENPVC4,'5'!D24:H24)+C24 $0.00 5.c. SUM , X fx =D14-D15 PGI growth Rate Op Ex growth rate Going out cap rate Selling costs Assumptions 3.00% per year 2.8% per year 7.0% 5% Cash Flow From Operations Year-O 1 Year-1 | Year-2 Year-3 Year 4 Year-5 PGI $2,058,743.40 $2,120,505.70 $2,184,120.87 $2,249,644.50 $2,317,133.83 Vacancy Loss $247,049.21 $254,460.68 $262,094.50 $269,957.34 $278,056.06 EGI $1,811,694.19 $1,866,045.02 $1,922,026.37 $1,979,687.16 $2,039,077.77 Operating Expenses $49,821.59 $51,316.24 $52,855.73 $54,441.40 $56,074.64 NOI I $1,761,872.60 $1,814,728.78 $1,869,170.64 $1,925,245.76 $1,983,003.14 ADS $536,898.241 $536,898.24 $536,898.24 $536,898.24 $536,898.24 Cash Flow from Operations | $1,828,800.00 1 $1,828,800.00 $1,828,800.00 $1,828,800.00 $1,828,800.00 Cost of Acquisition $10,324,966.15 Bank Loan $7,666,826.77 Equity Investment $2,658, 139.38 Future Sale Price $291,784.75 Selling Costs $14,589.24 Loan Balance $7,111,916.18 Cash Flow from Sale $6,820,131.43 BTCF | ($2,658,139,38) D14-D15 | $1,277,830,54 | $1,332,272,40 | $1,388,347.52 | $8,648,931.43 | Year-6 $2,386,647.85 $286,397.74 $2,100,250.11 $57,756.88 $2,042,493.23 $536,898.24 $1,828,800.00 IRR NPV @ loan rate NPV @IRR $8,419,309 5.b. $0.00 5.c. SUM , X fx =H23+H16 D E F G H I PGI growth Rate Op Ex growth rate Going out cap rate Selling costs Assumptions 3.00% per year 2.8% per year 7.0% | 5% Cash Flow From Operations Year-1 Year-2 Year-3 Year 4 $2,058,743.40 $2,120,505.70 $2,184,120.87 $2,249,644.50 $247,049.21 $254,460.68 $262,094.50 $269,957.34 $1,811,694.19 $1,866,045.02 $1,922,026.37 | $1,979,687.16 $49,821.59 $51,316.24 $52,855.73 $54,441.40 $1,761,872.60 $1,814,728.78 $1,869, 170.64 $1,925,245.76 $536,898.24 $536,898.24 $536,898.24 $536,898.24 $1,828,800.00 $1,828,800.00 $1,828,800.00 $1,828,800.00 Year-5 $2,317,133.83 $278,056.06 $2,039,077.77 $56,074.64 $1,983,003.14 $536,898.24 | $1,828,800.00 Year-6 $2,386,647.85 $286,397.74 $2,100,250.11 $57,756.88 $2,042,493.23 $536,898.24 $1,828,800.00 Year-0 PG Vacancy Loss EGI Operating Expenses NOI ADS Cash Flow from Operations Cost of Acquisition $10,324,966.15 Bank Loan $7,666,826.77 Equity Investment $2,658, 139.38 Future Sale Price Selling Costs Loan Balance Cash Flow from Sale BTCF ($2,658,139.38)| S291.784.75 $14,589.24 I $7,111,916.18 | $6,820,131.43 $1,388,347.52=H23+116 $1,224,974.36 $1,277,830.54 $1,332,272.40 IRR NPV @loan rate 59.4% 5.a. $8,419,309 5.b. $0.00 5.c
Step by Step Solution
There are 3 Steps involved in it
Step: 1

Get Instant Access to Expert-Tailored Solutions
See step-by-step solutions with expert insights and AI powered tools for academic success
Step: 2

Step: 3

Ace Your Homework with AI
Get the answers you need in no time with our AI-driven, step-by-step assistance
Get Started


