

Answered step by step
Verified Expert Solution
Question
1 Approved Answer
are of considerable value to the managers of companies looking for strong evidence that their company needs to cut branded footwear prices in the
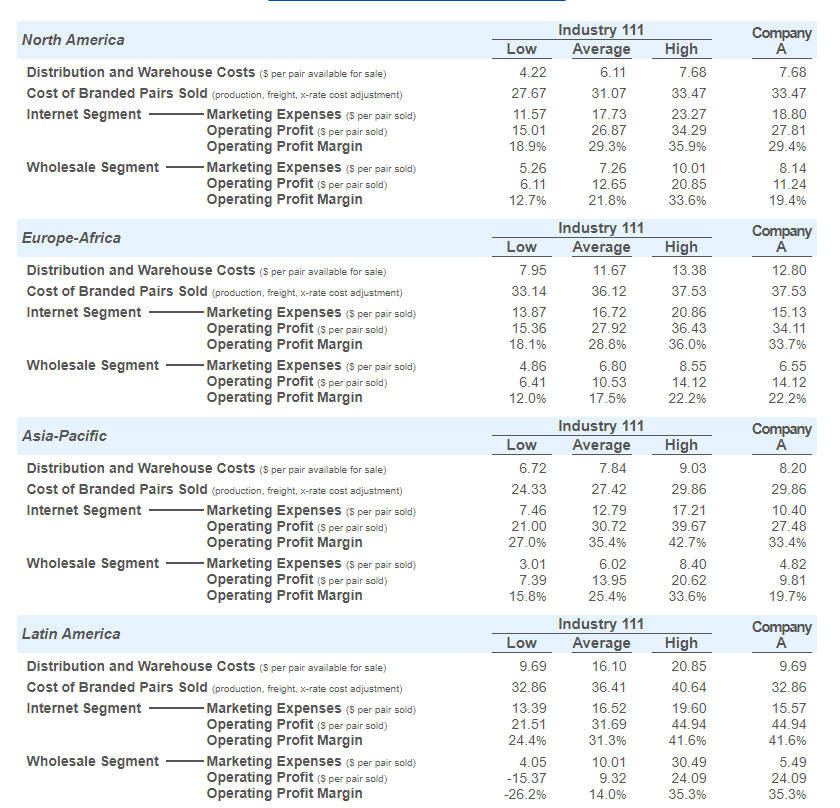
are of considerable value to the managers of companies looking for strong evidence that their company needs to cut branded footwear prices in the internet and wholesale segments and/or spend more money on marketing efforts so as to increase branded sales and market share in one or more geographic regions. are most valuable to the managers of companies whose ROE was well below the reported ROE industry-average benchmark in one or more regions. have little-decision-making value because the benchmarking data do not identify which companies have the lowest/highest operating profit margins per branded pair sold. have the greatest value to the managers of companies whose market share outcomes were below the reported industry-average benchmark for market share in one or more geographic regions. always merit close attention because when these benchmarks reveal that a company's operating profits are negative or unattractively small in one or more geographic regions, managers are well-advised to pursue immediate corrective actions in the upcoming decision round. Industry 111 North America Low Average High Company A Distribution and Warehouse Costs ($ per pair available for sale) Cost of Branded Pairs Sold (production, freight, x-rate cost adjustment) 4.22 6.11 7.68 7.68 27.67 31.07 33.47 33.47 Internet Segment -Marketing Expenses ($ per pair sold) Operating Profit ($ per pair sold) Operating Profit Margin 11.57 17.73 23.27 18.80 15.01 26.87 34.29 27.81 18.9% 29.3% 35.9% 29.4% Wholesale Segment -Marketing Expenses ($ per pair sold) 5.26 7.26 10.01 8.14 Operating Profit ($ per pair sold) Operating Profit Margin 6.11 12.65 20.85 11.24 12.7% 21.8% 33.6% 19.4% Industry 111 Europe-Africa Low Average High Company A Distribution and Warehouse Costs ($ per pair available for sale) 7.95 11.67 13.38 12.80 Cost of Branded Pairs Sold (production, freight, x-rate cost adjustment) Internet Segment 33.14 36.12 37.53 37.53 -Marketing Expenses ($ per pair sold) 13.87 16.72 20.86 15.13 Operating Profit ($ per pair sold) Operating Profit Margin 15.36 27.92 36.43 34.11 18.1% 28.8% 36.0% 33.7% Wholesale Segment -Marketing Expenses ($ per pair sold) Operating Profit ($ per pair sold) Operating Profit Margin 4.86 6.80 8.55 6.55 6.41 10.53 14.12 14.12 12.0% 17.5% 22.2% 22.2% Industry 111 Asia-Pacific Low Average High Company A Distribution and Warehouse Costs ($ per pair available for sale) 6.72 7.84 9.03 8.20 Cost of Branded Pairs Sold (production, freight, x-rate cost adjustment) Internet Segment 24.33 27.42 29.86 29.86 -Marketing Expenses ($ per pair sold) Operating Profit ($ per pair sold) Operating Profit Margin 7.46 12.79 17.21 10.40 21.00 30.72 39.67 27.48 27.0% 35.4% 42.7% 33.4% Wholesale Segment -Marketing Expenses ($ per pair sold) Operating Profit ($ per pair sold) Operating Profit Margin 3.01 6.02 8.40 4.82 7.39 13.95 20.62 9.81 15.8% 25.4% 33.6% 19.7% Industry 111 Latin America Distribution and Warehouse Costs ($ per pair available for sale) Low Average High Company A 9.69 16.10 20.85 9.69 Cost of Branded Pairs Sold (production, freight, x-rate cost adjustment) 32.86 36.41 40.64 32.86 Internet Segment -Marketing Expenses ($ per pair sold) 13.39 16.52 19.60 15.57 Operating Profit ($ per pair sold) 21.51 31.69 44.94 44.94 Operating Profit Margin 24.4% 31.3% 41.6% 41.6% Wholesale Segment -Marketing Expenses ($ per pair sold) 4.05 10.01 30.49 5.49 Operating Profit ($ per pair sold) -15.37 9.32 24.09 24.09 Operating Profit Margin -26.2% 14.0% 35.3% 35.3%
Step by Step Solution
There are 3 Steps involved in it
Step: 1

Get Instant Access to Expert-Tailored Solutions
See step-by-step solutions with expert insights and AI powered tools for academic success
Step: 2

Step: 3
Ace Your Homework with AI
Get the answers you need in no time with our AI-driven, step-by-step assistance
Get Started
Fundamentals of Financial Management
Authors: Eugene F. Brigham, Joel F. Houston
Concise 6th Edition
324664559, 978-0324664553