Are you smarter than your older brother? In a study of birth order and intelligence, IQ tests were given to 18- and 19-year-old men to
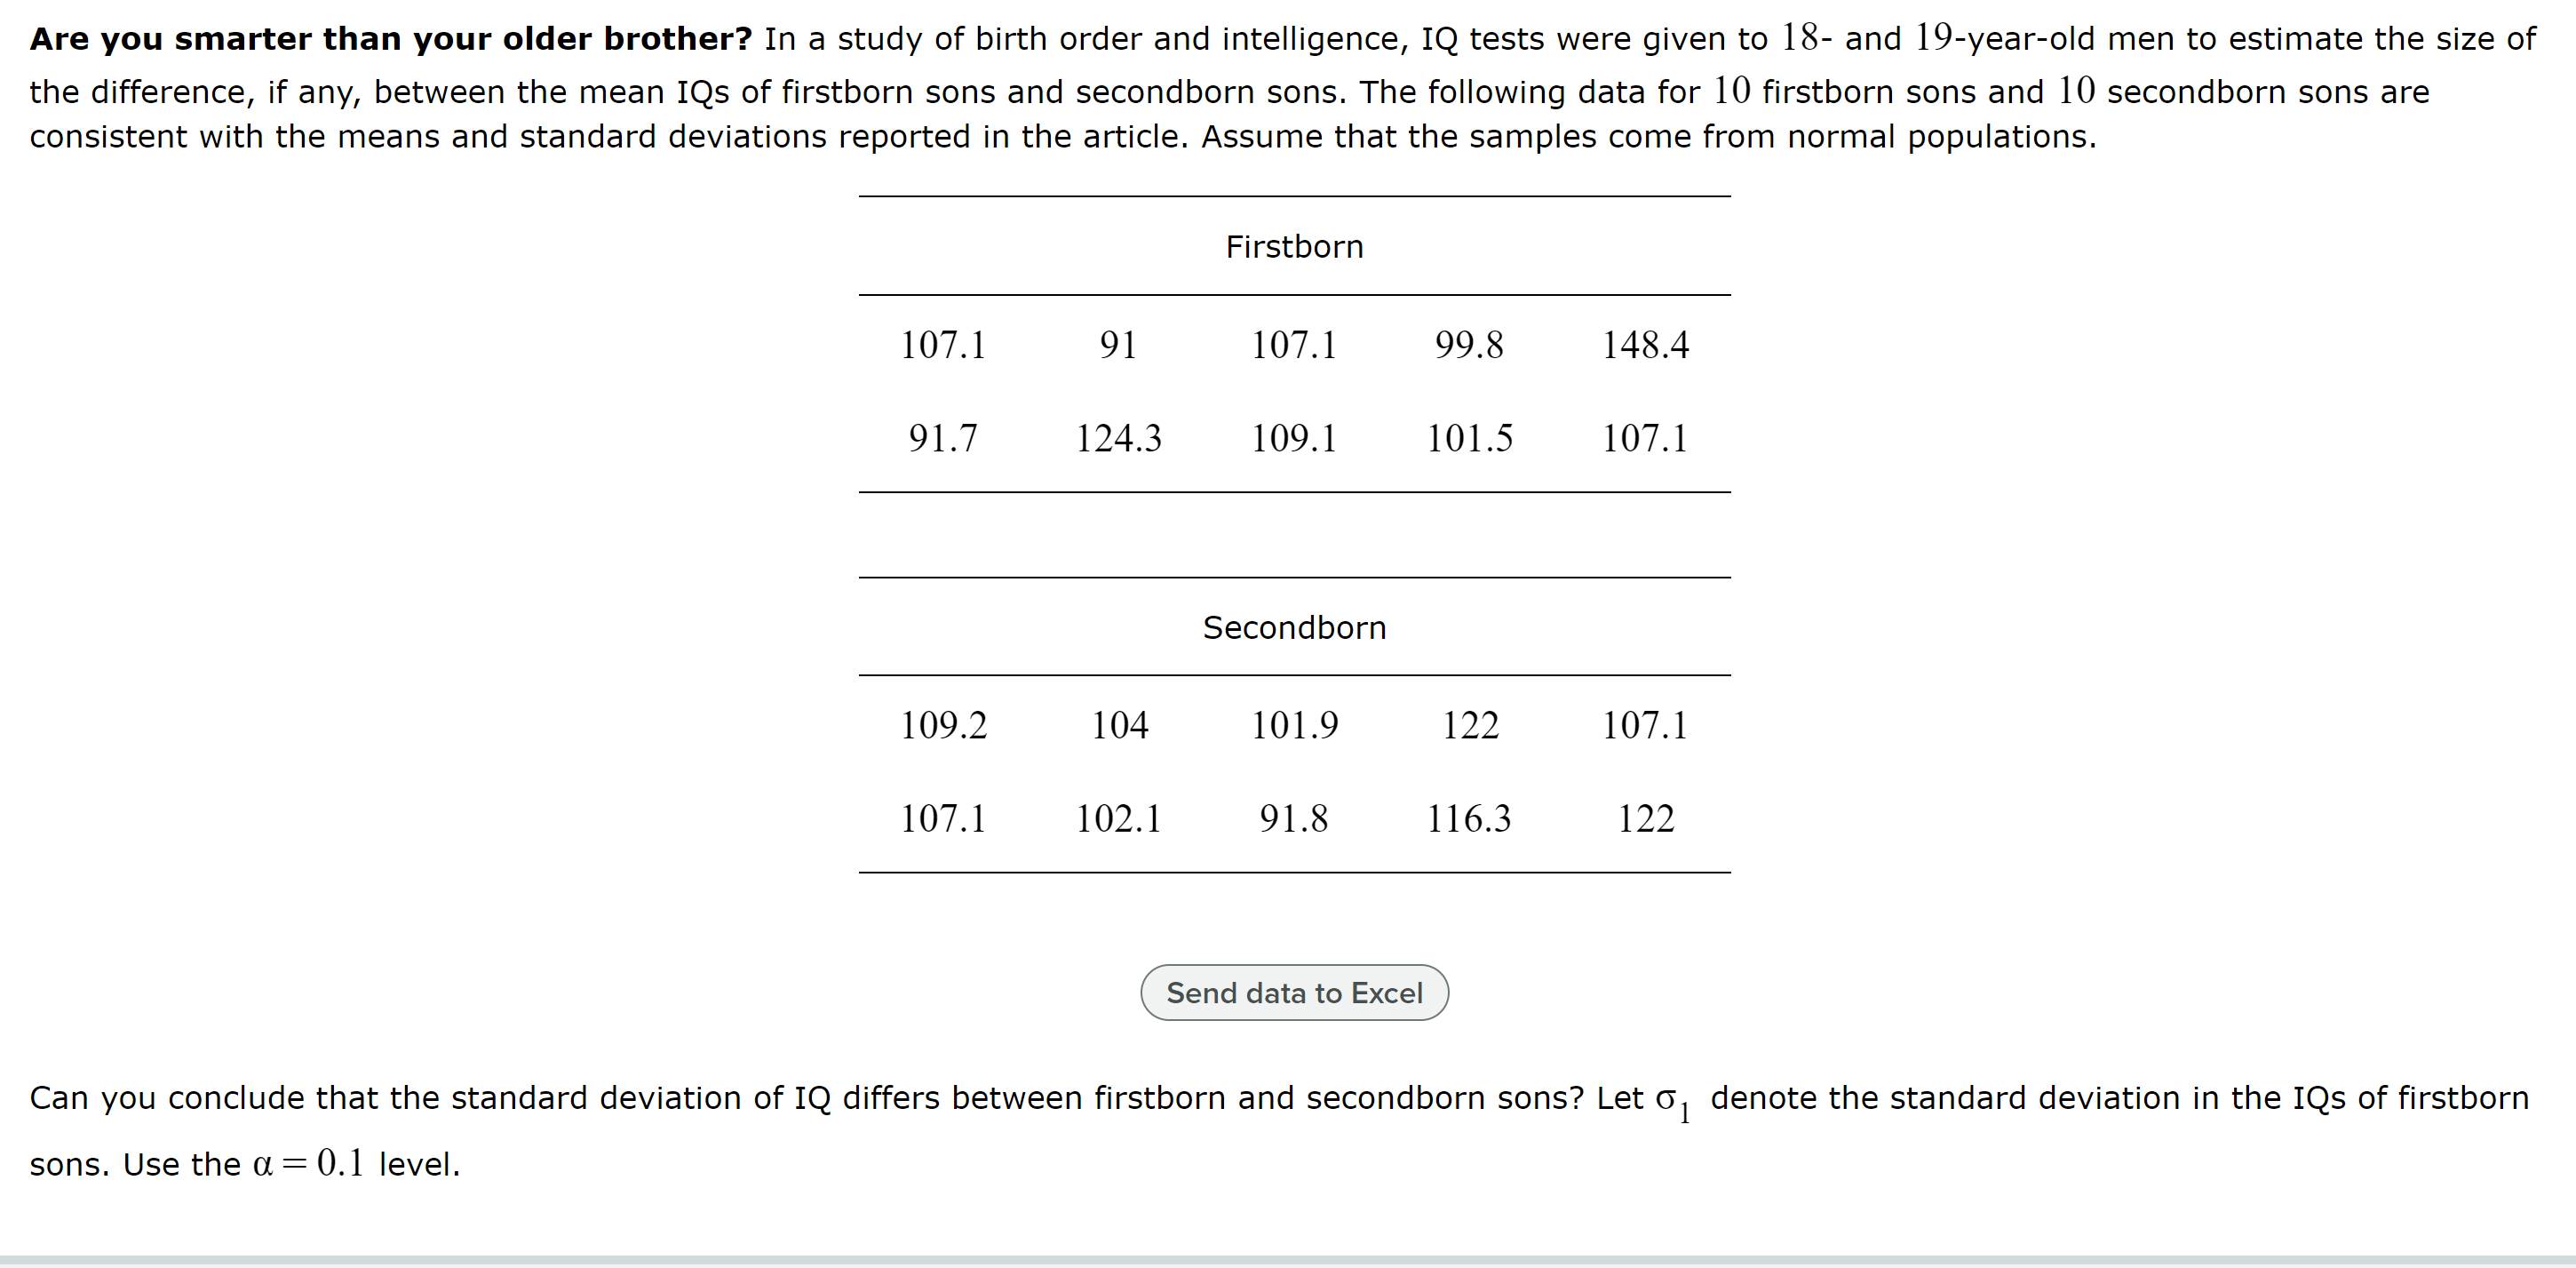
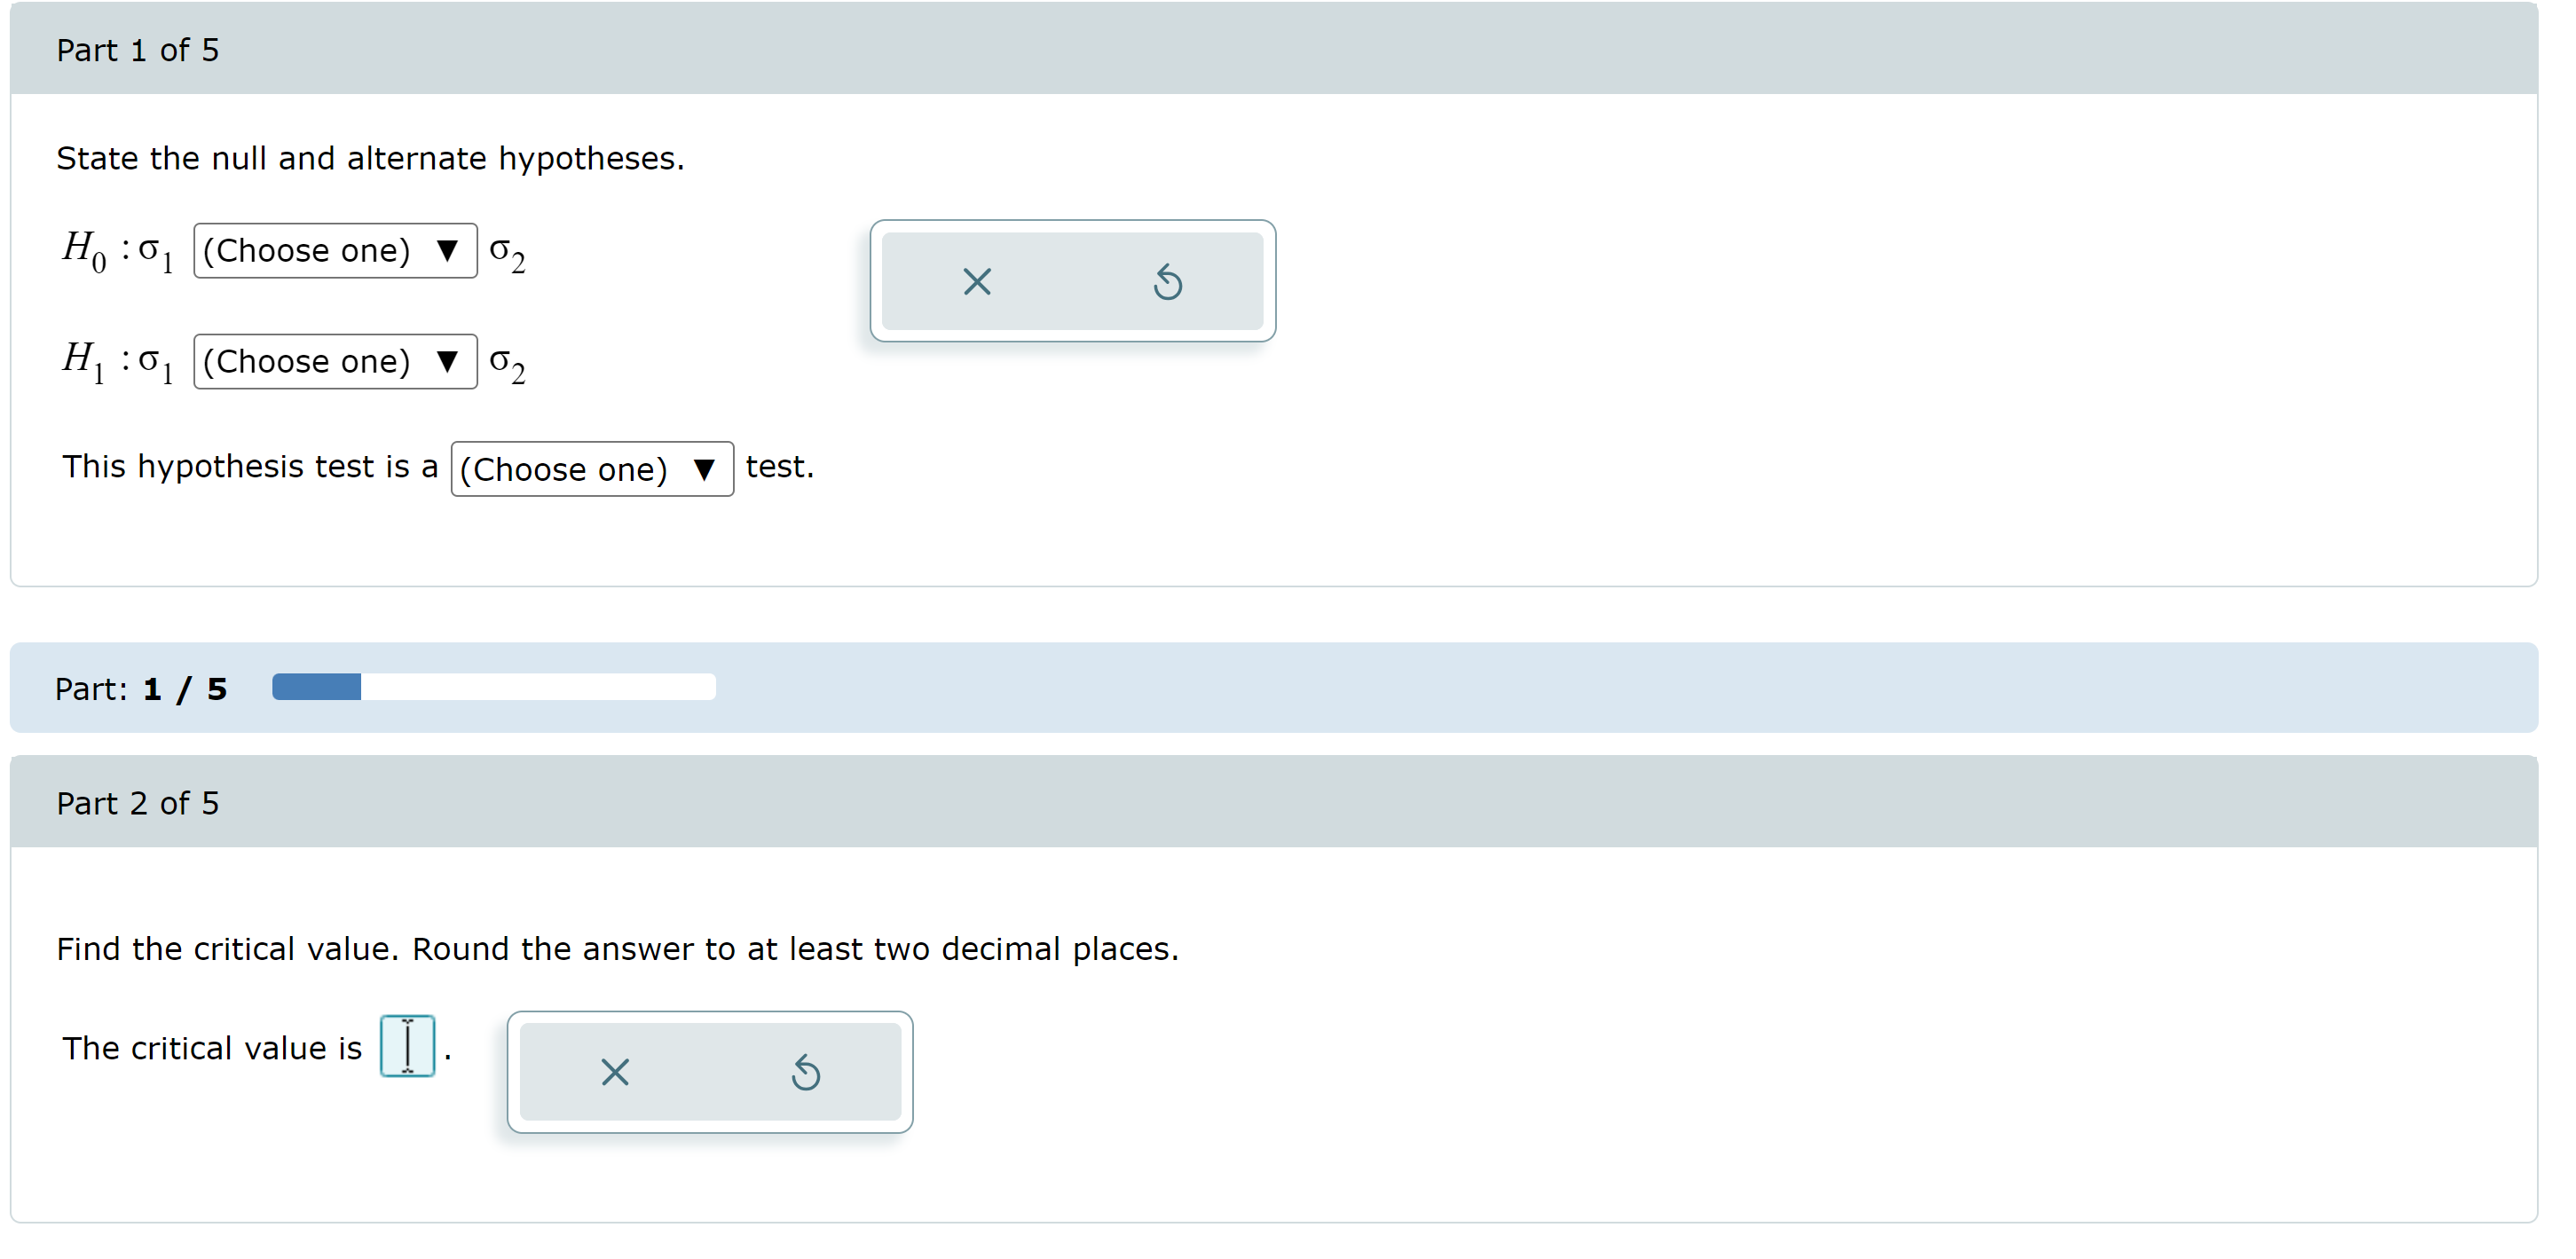
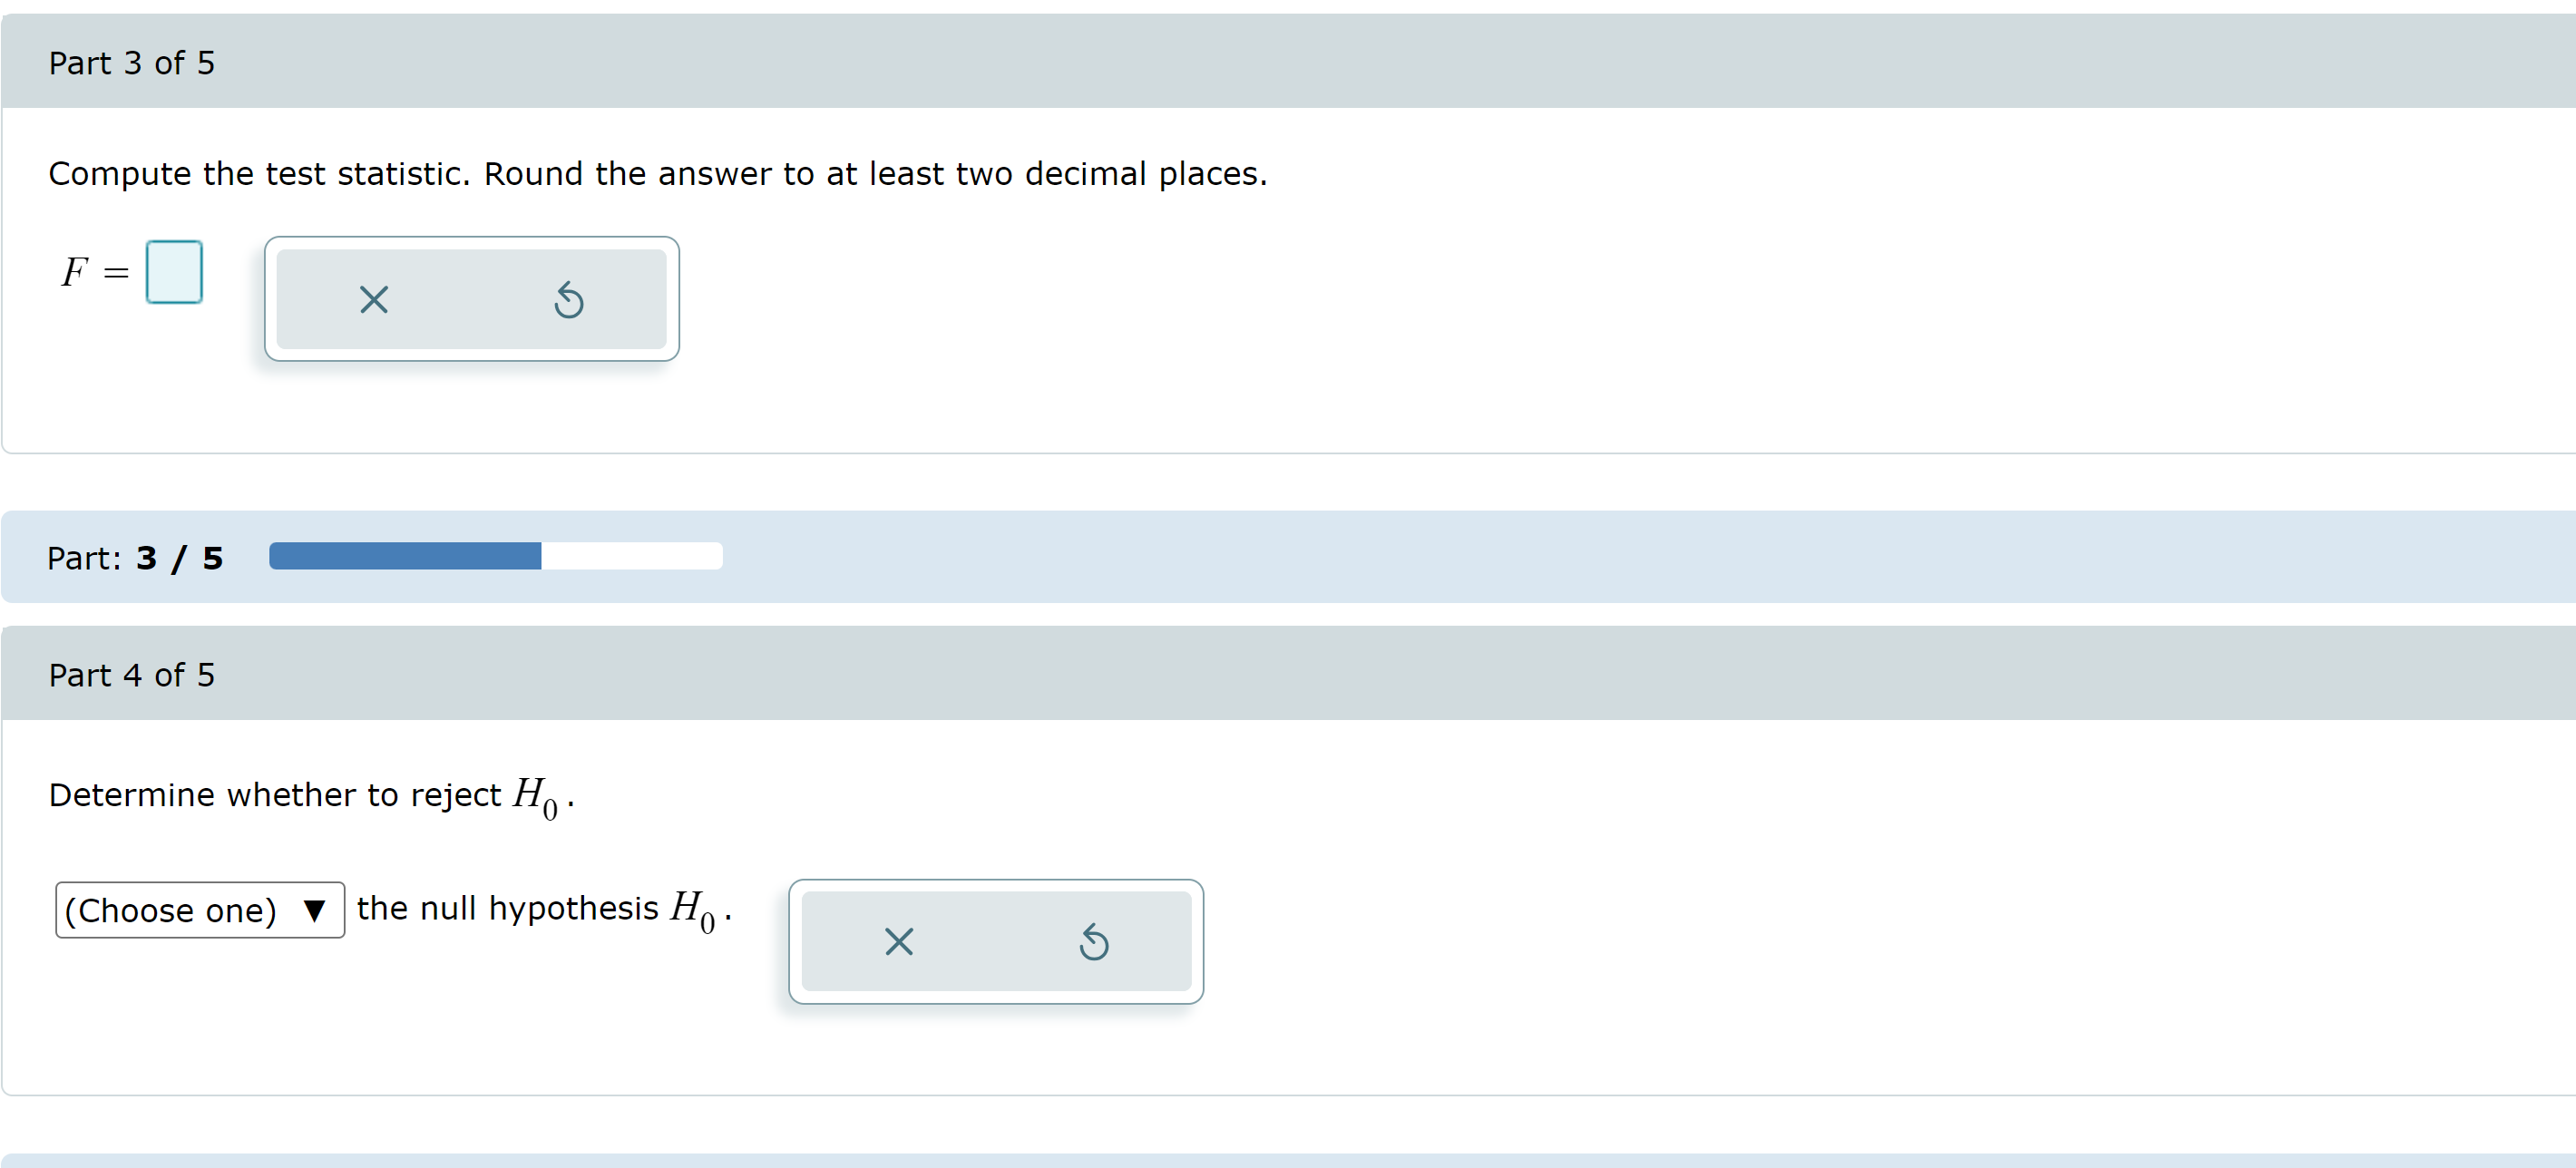
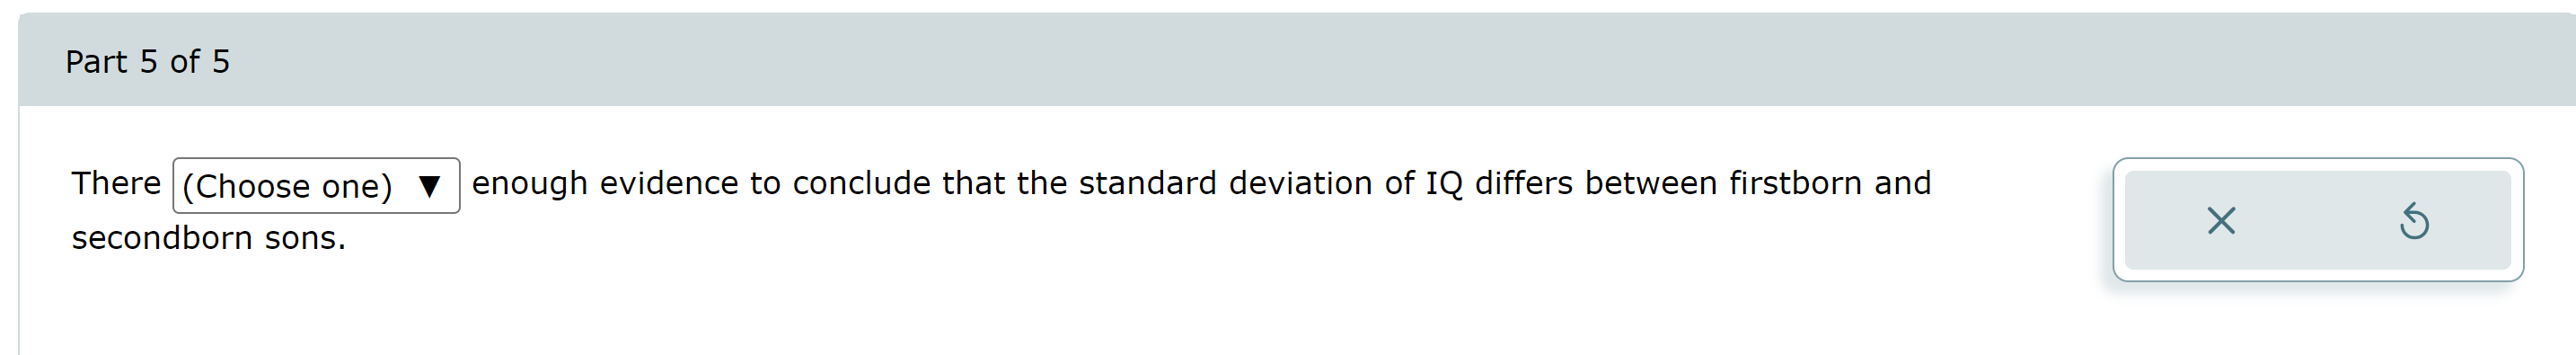
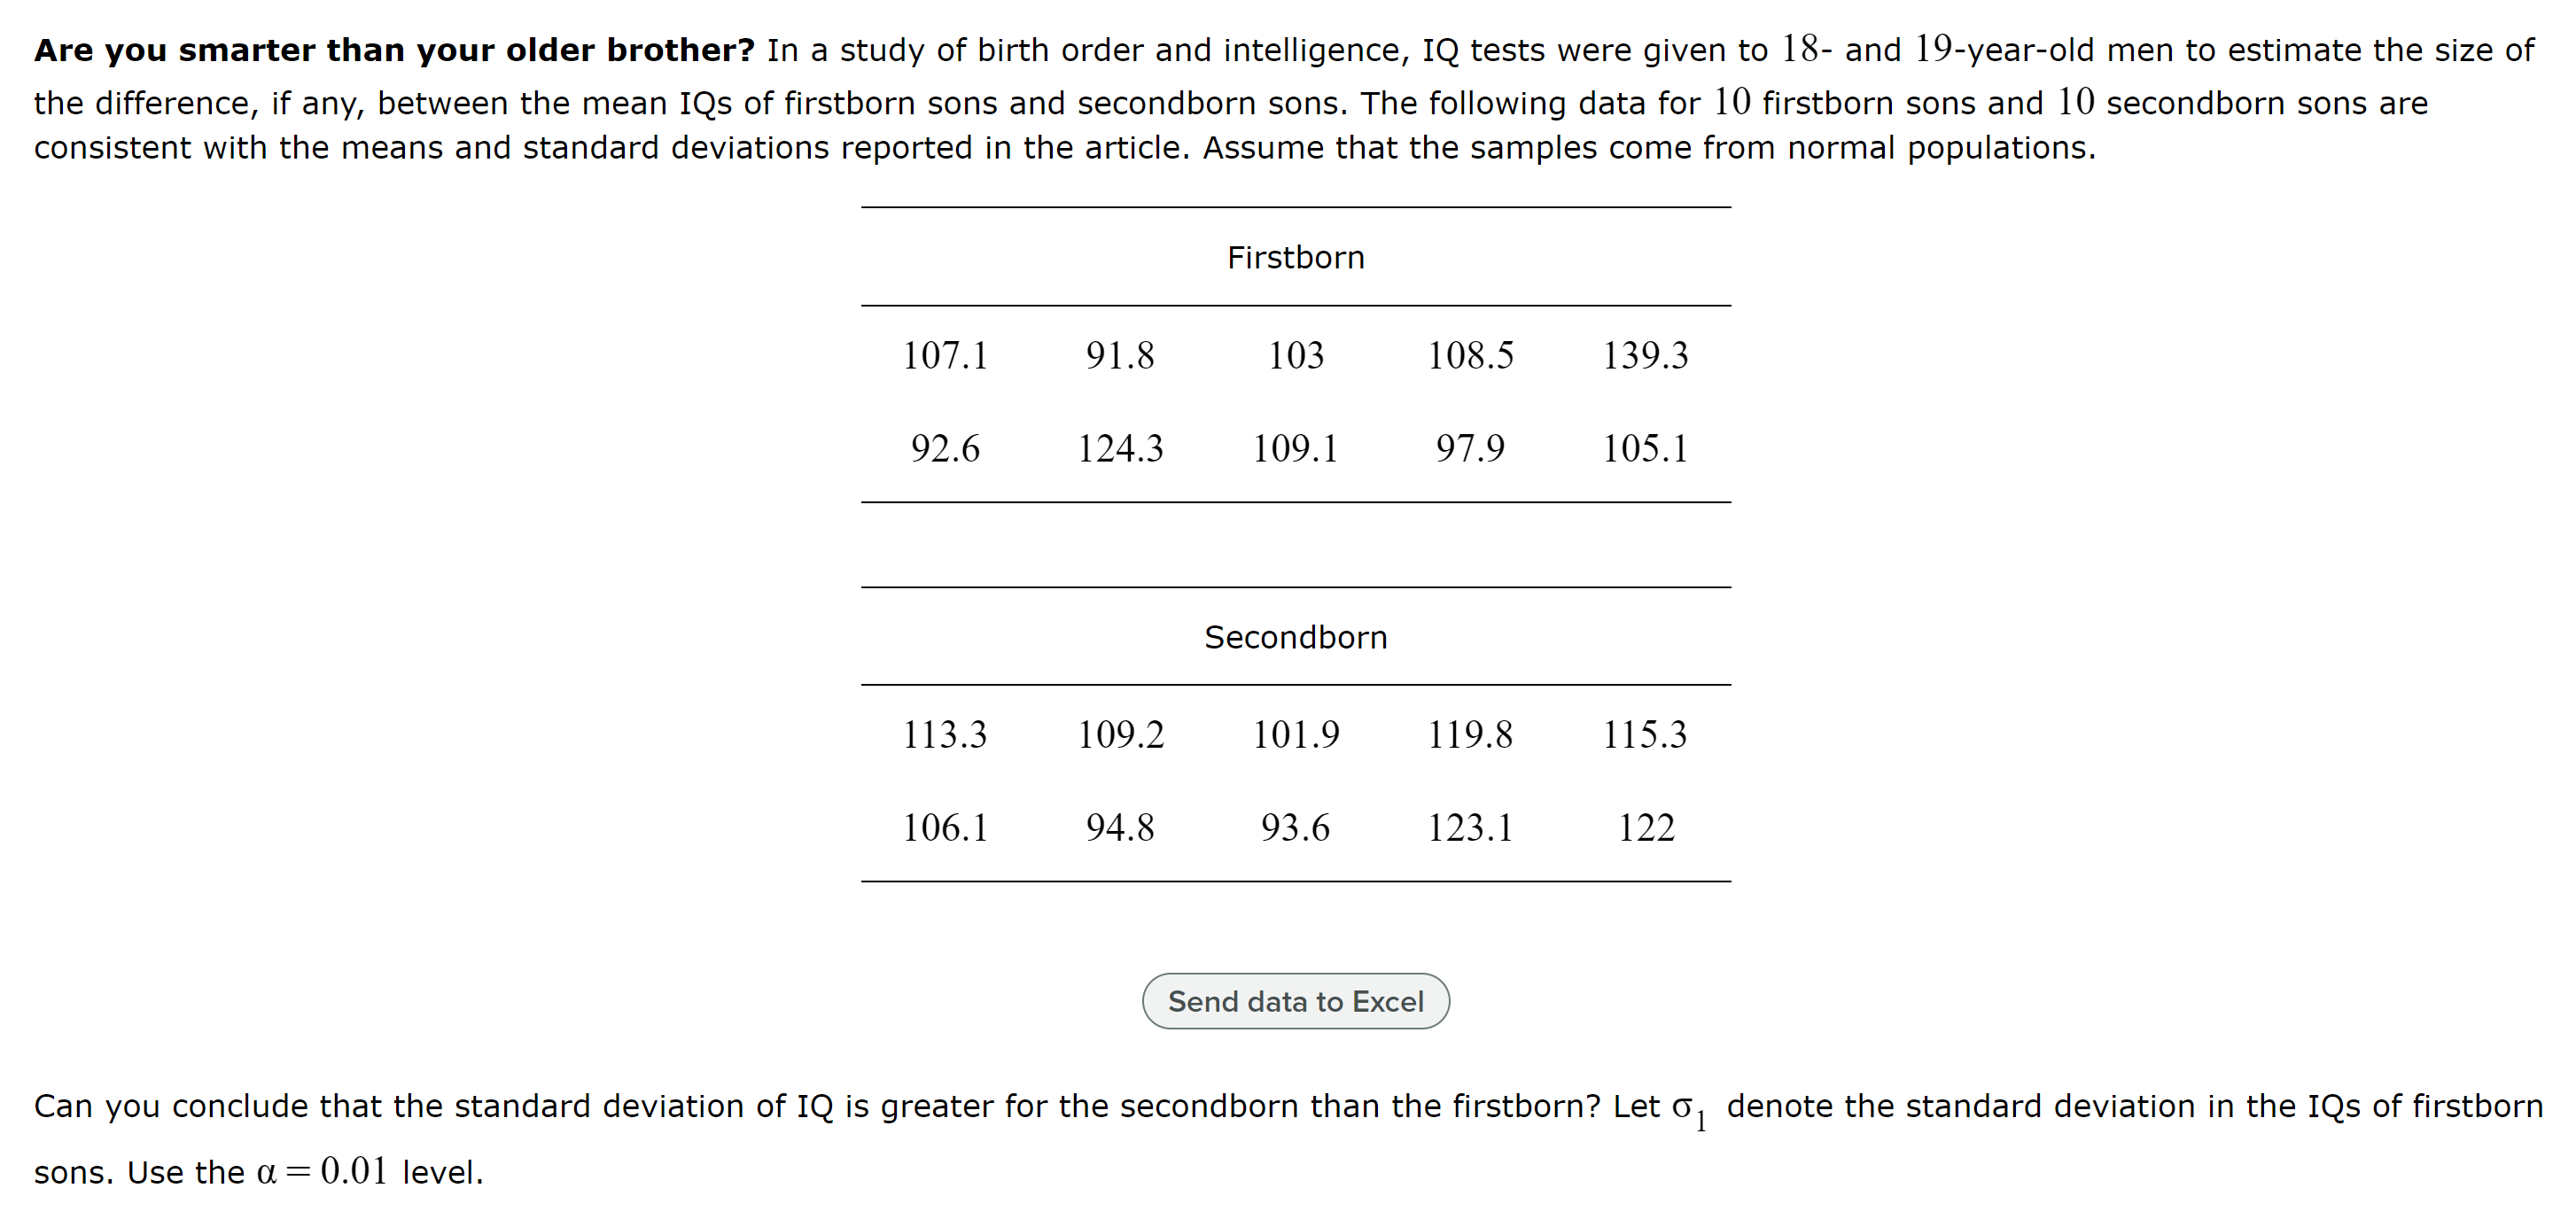
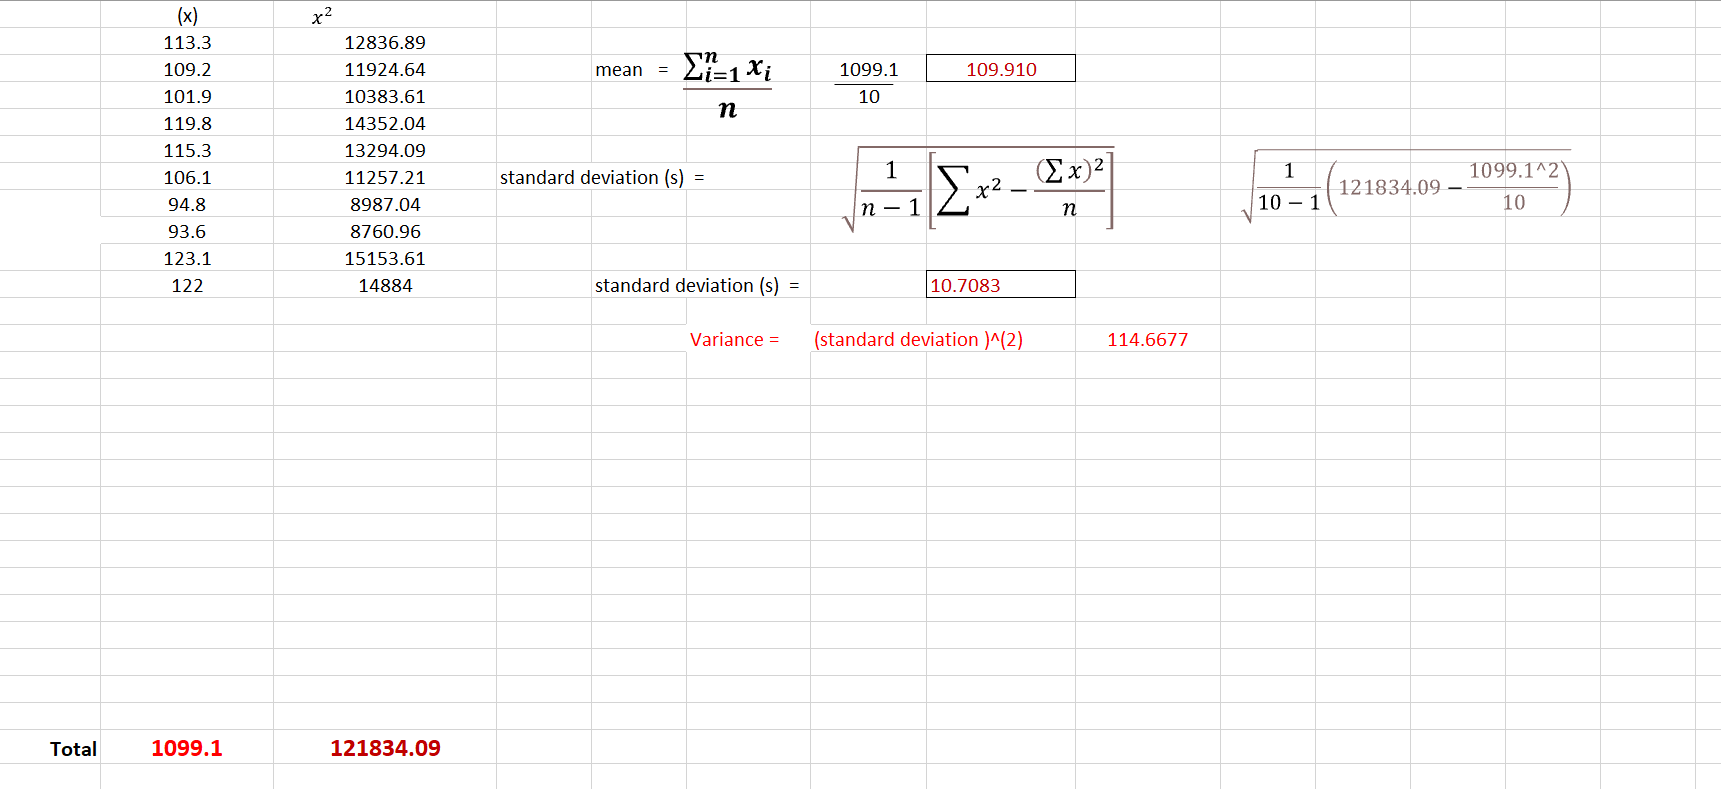
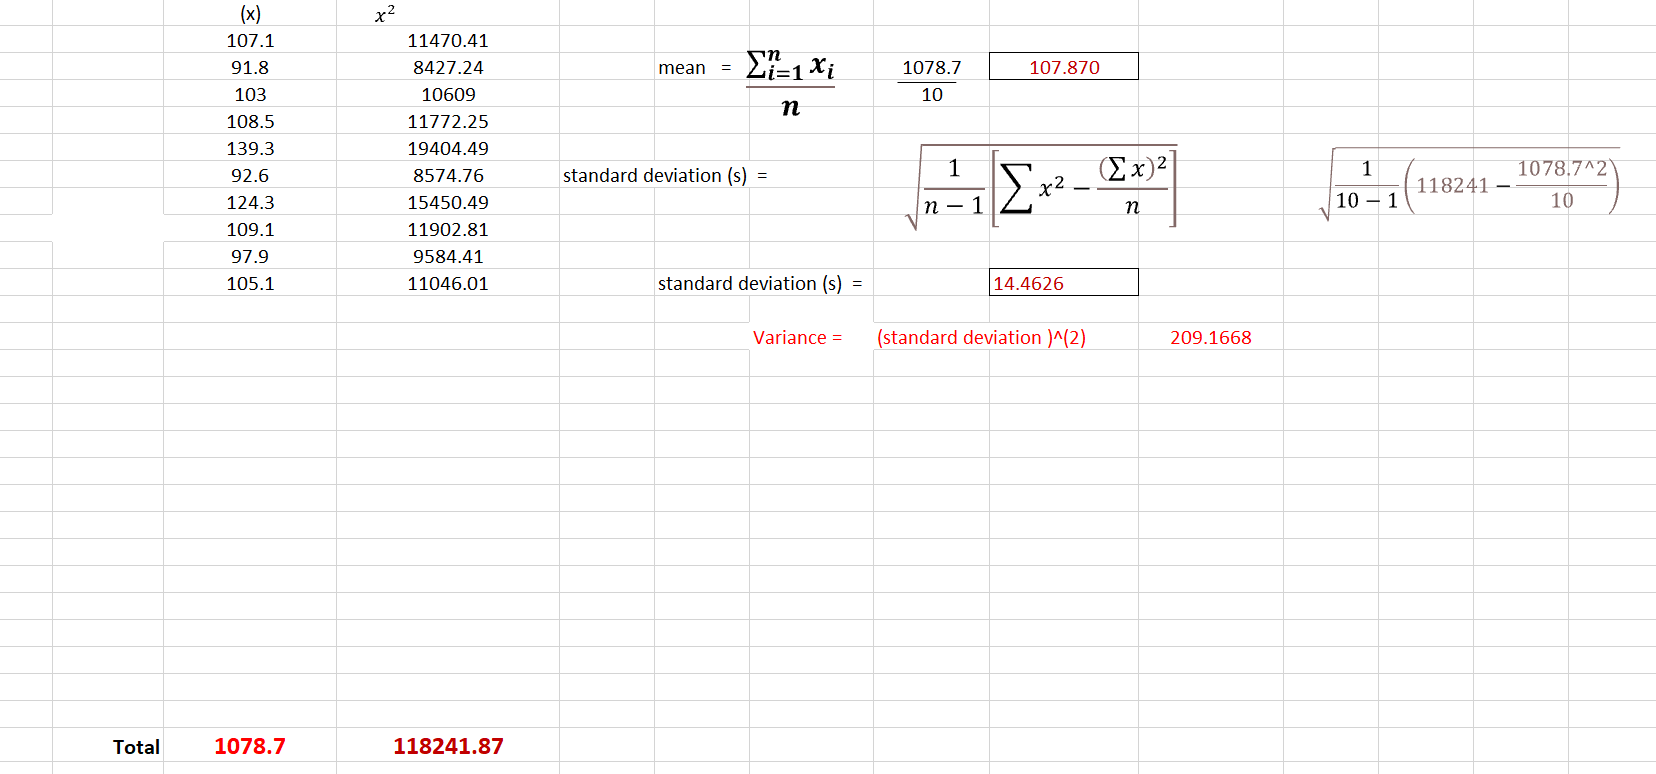
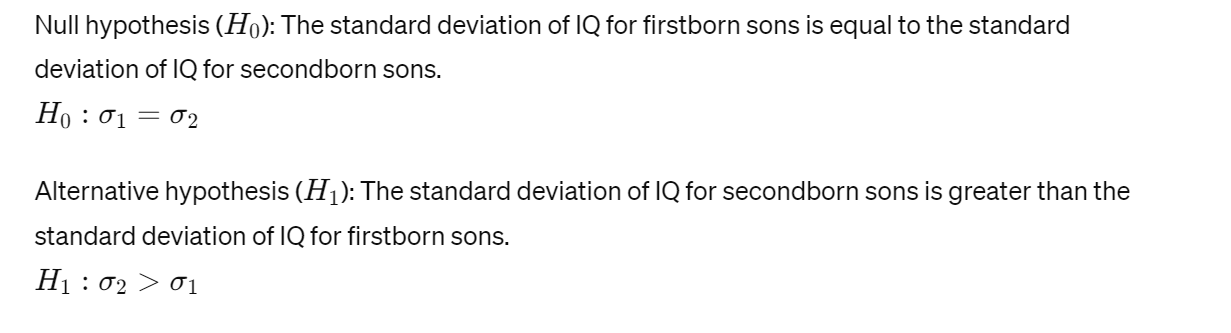
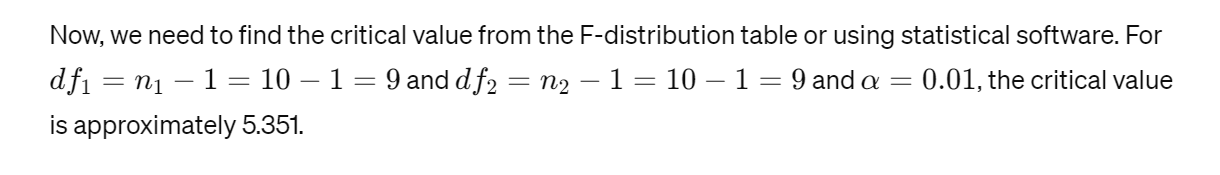
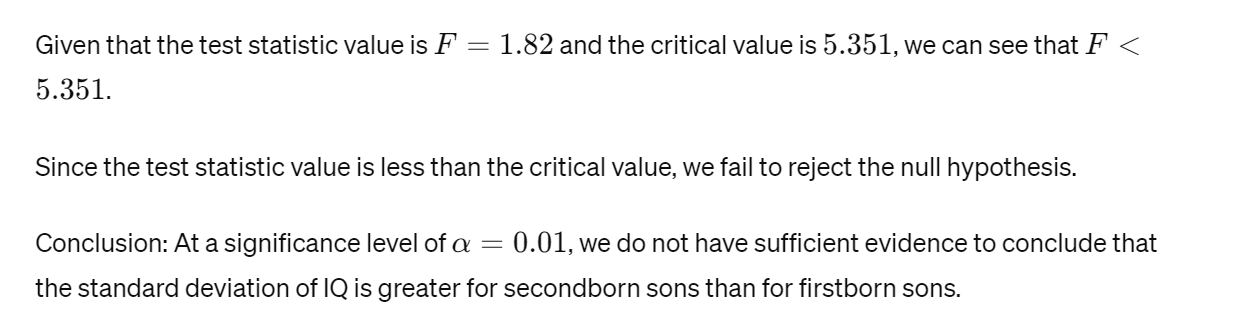
Are you smarter than your older brother? In a study of birth order and intelligence, IQ tests were given to 18- and 19-year-old men to estimate the size of the difference, if any, between the mean IQs of firstborn sons and secondborn sons. The following data for 10 firstborn sons and 10 secondborn sons are consistent with the means and standard deviations reported in the article. Assume that the samples come from normal populations. Firstborn 107.1 91 107.1 99.8 148.4 91.7 124.3 109.1 101.5 107.1 Secondborn 109.2 104 101.9 122 107.1 107.1 102.1 91.8 116.3 122 Send data to Excel Can you conclude that the standard deviation of IQ differs between firstborn and secondborn sons? Let G, denote the standard deviation in the IQs of firstborn sons. Use the a=0.1 level. Part 1 of 5 State the null and alternate hypotheses. H, :6, |(Choose one) |G, H, :6, |(Choose one) |G, This hypothesis test is a | (Choose one) V |test. Part: 1 /5 N Part 2 of 5 Find the critical value. Round the answer to at least two decimal places. LIL/N ' X S The critical value is Compute the test statistic. Round the answer to at least two decimal places. -0 ( Determine whether to reject H,, . (Choose one) V |the null hypothesis HO' E Part 5 of 5 There | (Choose one) |enough evidence to conclude that the standard deviation of IQ differs between firstborn and secondborn sons. Are you smarter than your older brother? In a study of birth order and intelligence, IQ tests were given to 18- and 19-year-old men to estimate the size of the difference, if any, between the mean IQs of firstborn sons and secondborn sons. The following data for 10 firstborn sons and 10 secondborn sons are consistent with the means and standard deviations reported in the article. Assume that the samples come from normal populations. Firstborn 107.1 91.8 103 108.5 139.3 92.6 124.3 109.1 97.9 105.1 Secondborn 113.3 109.2 101.9 119.8 115.3 106.1 94.8 93.6 123.1 122 Send data to Excel Can you conclude that the standard deviation of IQ is greater for the secondborn than the firstborn? Let 9 denote the standard deviation in the IQs of firstborn sons. Use the o= 0.01 level. ( x) x2 113.3 12836.89 109.2 11924.64 mean = 1 Xi 1099.1 109.910 101.9 10383.61 10 119.8 14352.04 n 115.3 13294.09 106.1 11257.21 standard deviation (s) = 1 1 1099.1^2 94.8 8987.04 121834.09 - n n 10 - 1 10 93.6 8760.96 123.1 15153.61 122 14884 standard deviation (s) = 10.7083 Variance = (standard deviation )^(2) 114.6677 Total 1099.1 121834.09(x ) x2 107.1 11470.41 91.8 8427.24 mean = Lit1 Xi 1078.7 107.870 103 10609 10 108.5 11772.25 n 139.3 19404.49 92.6 8574.76 standard deviation (s) = 1 1 1078.7^2 124.3 15450.49 1 72 ( 2x ) 2 118241 - n - n 10 - 1 10 109.1 11902.81 97.9 9584.41 105.1 11046.01 standard deviation (s) = 14.4626 Variance = (standard deviation )^(2) 209.1668 Total 1078.7 118241.87Null hypothesis (Ho): The standard deviation of IQ for firstborn sons is equal to the standard deviation of IQ for secondborn sons. Ho : 01 = 02 Alternative hypothesis (H1): The standard deviation of IQ for secondborn sons is greater than the standard deviation of IQ for firstborn sons. H1 : 02 > 01Now, we need to find the critical value from the F-distribution table or using statistical software. For df1 = n1 - 1 =10-1 =9 and df2 = n2 - 1 =10 -1 = 9 and a = 0.01, the critical value is approximately 5.351.Given that the test statistic value is /' = 1.82 and the critical value is 5.351, we can see that F'
Step by Step Solution
There are 3 Steps involved in it
Step: 1
Get Instant Access to Expert-Tailored Solutions
See step-by-step solutions with expert insights and AI powered tools for academic success
Step: 2
Step: 3
Ace Your Homework with AI
Get the answers you need in no time with our AI-driven, step-by-step assistance