As a consultant, you are commissioned to prepare a report for presenting by the non-executive directors of the company (FOR BANK OF SCOTLAND PLC) In the report, you will analyse the risk performance of the bank over the last 5 years, identify its strengths and limitations, and provide appropriate recommendations for its future performance.
Your analysis should include: a consideration of the current state and changes in: INTEREST RATE RISK
400 - 350 words required ( can include graphs or tables) please provide this on a work document, I have provided the date below needed to create an answer:

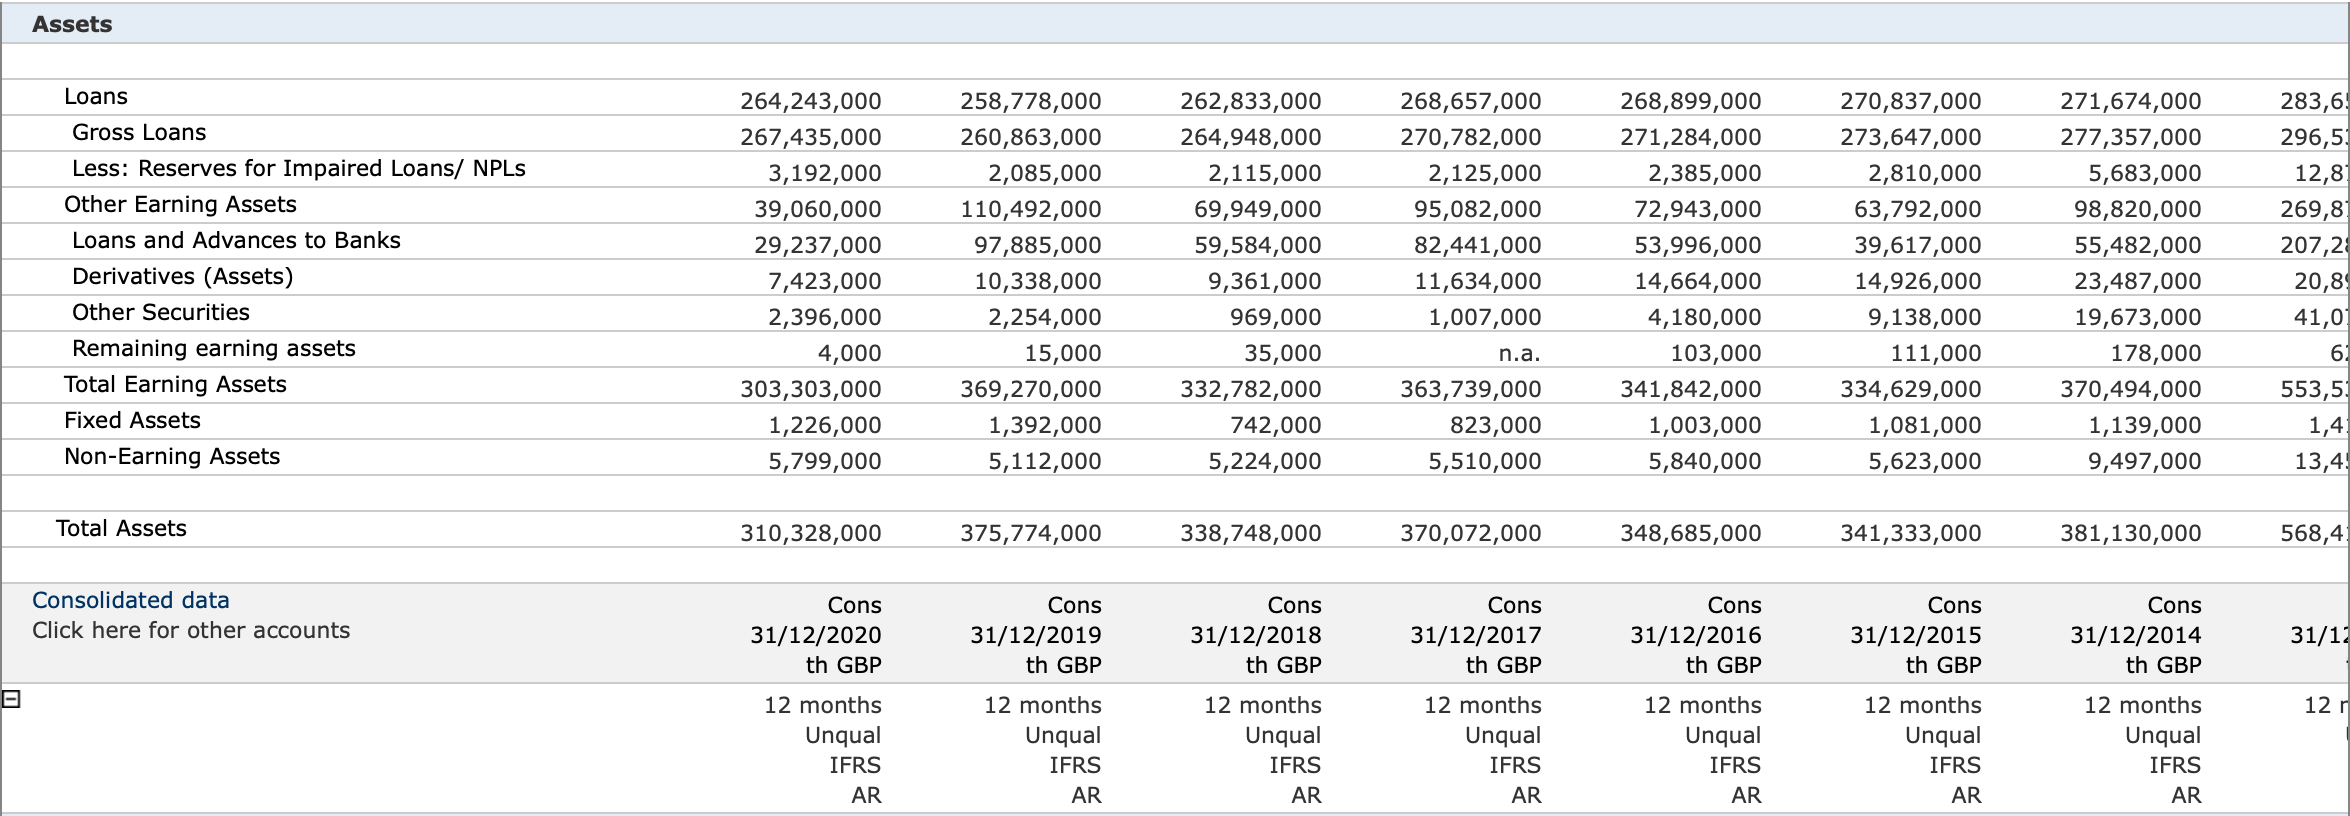
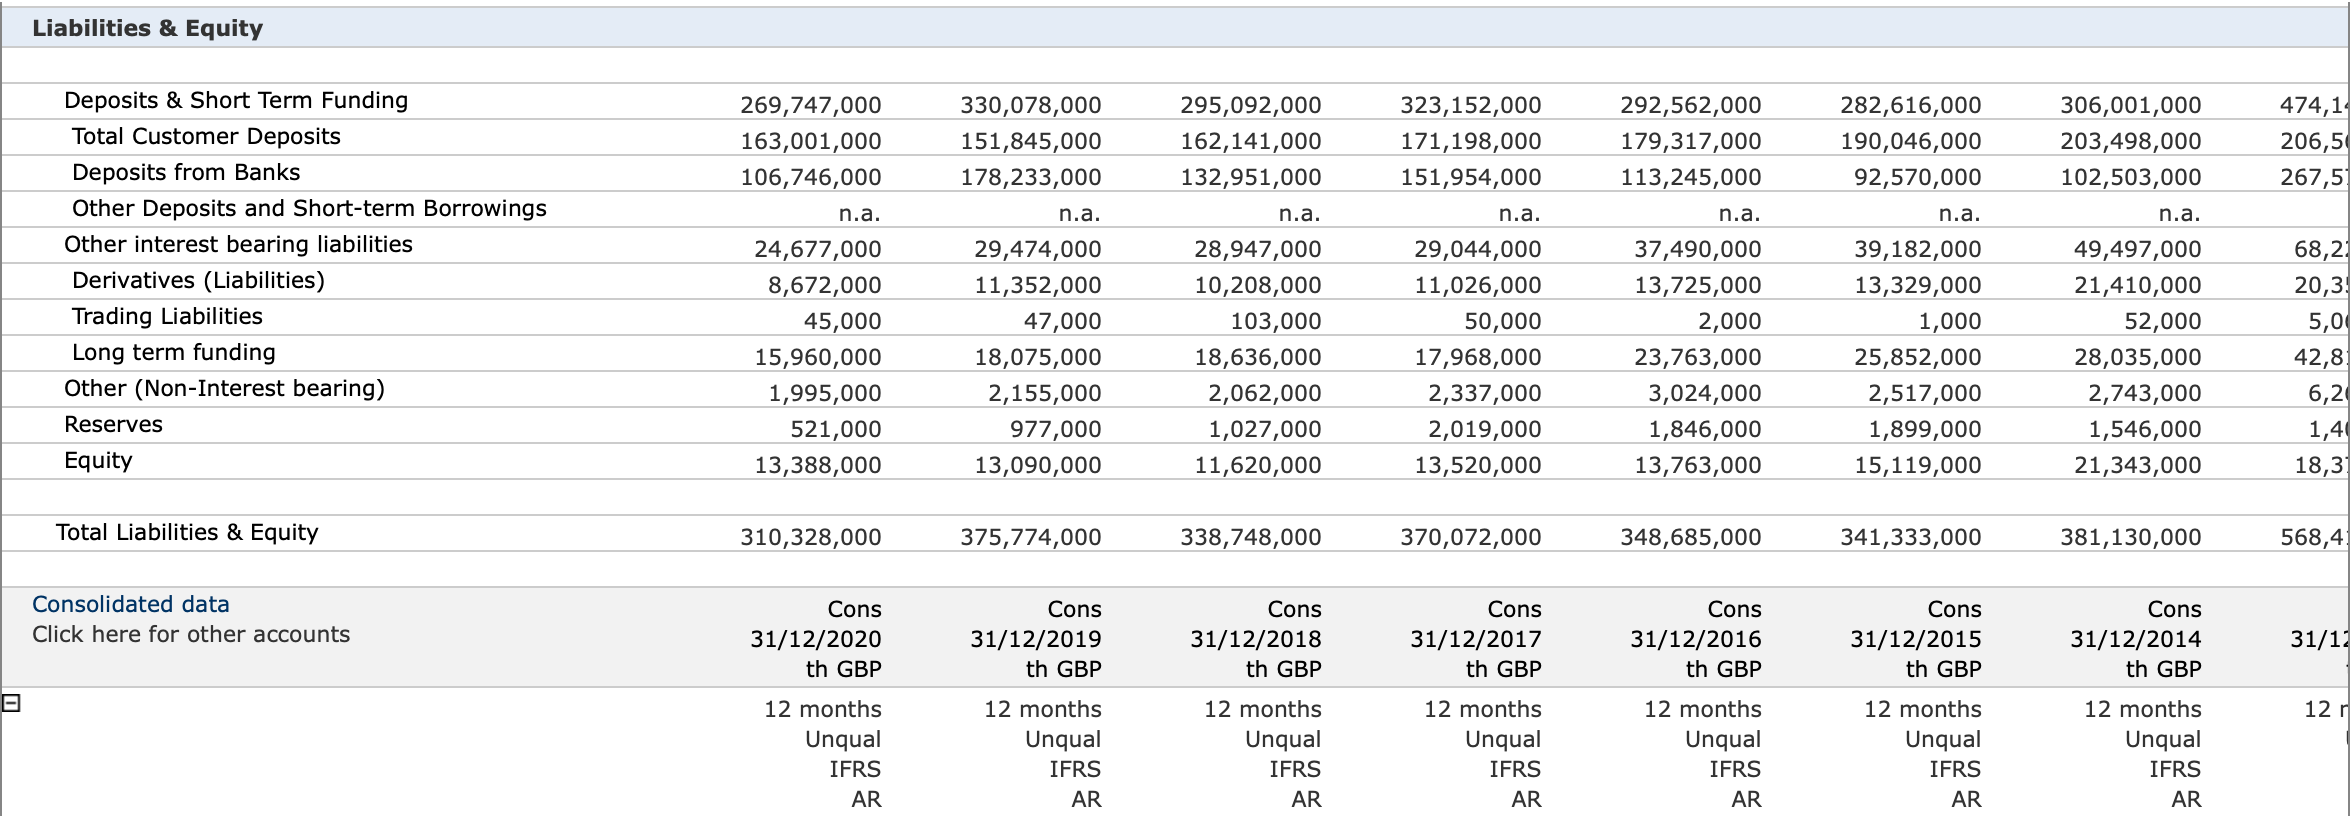

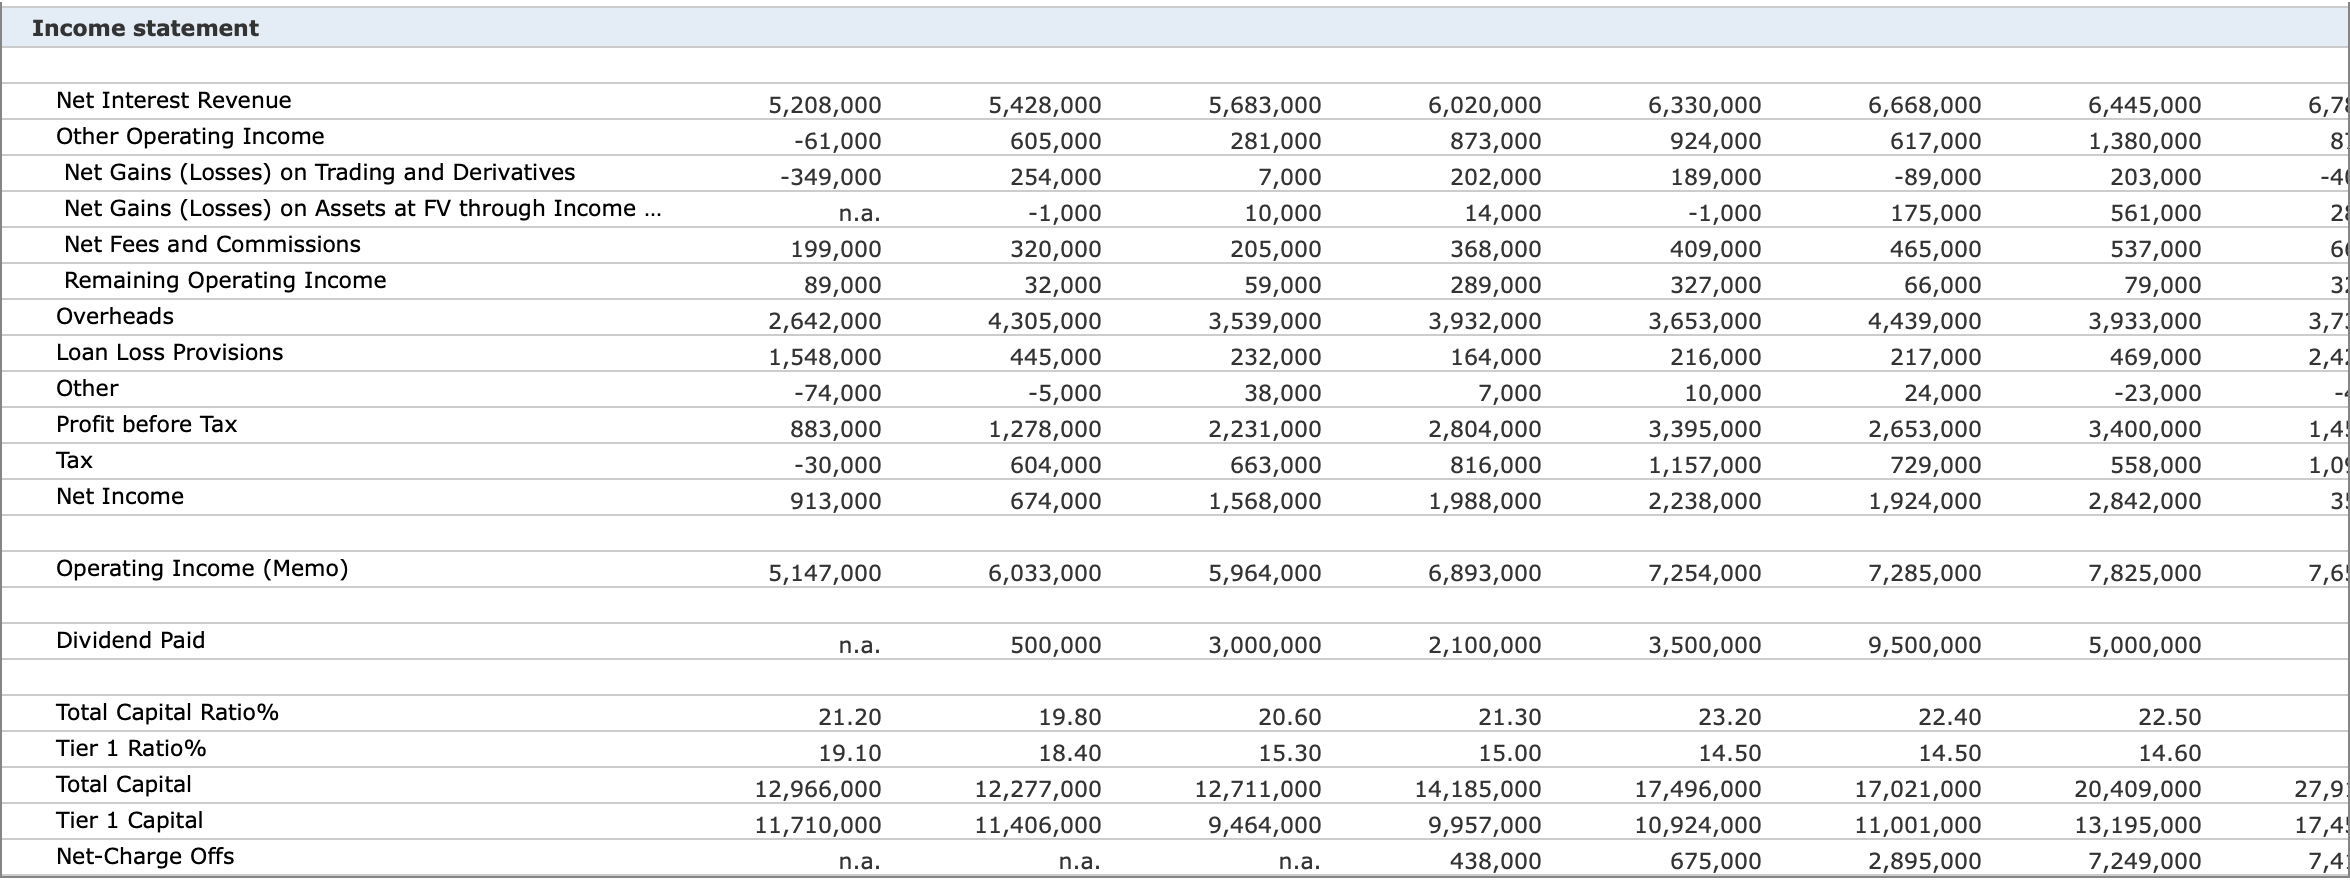


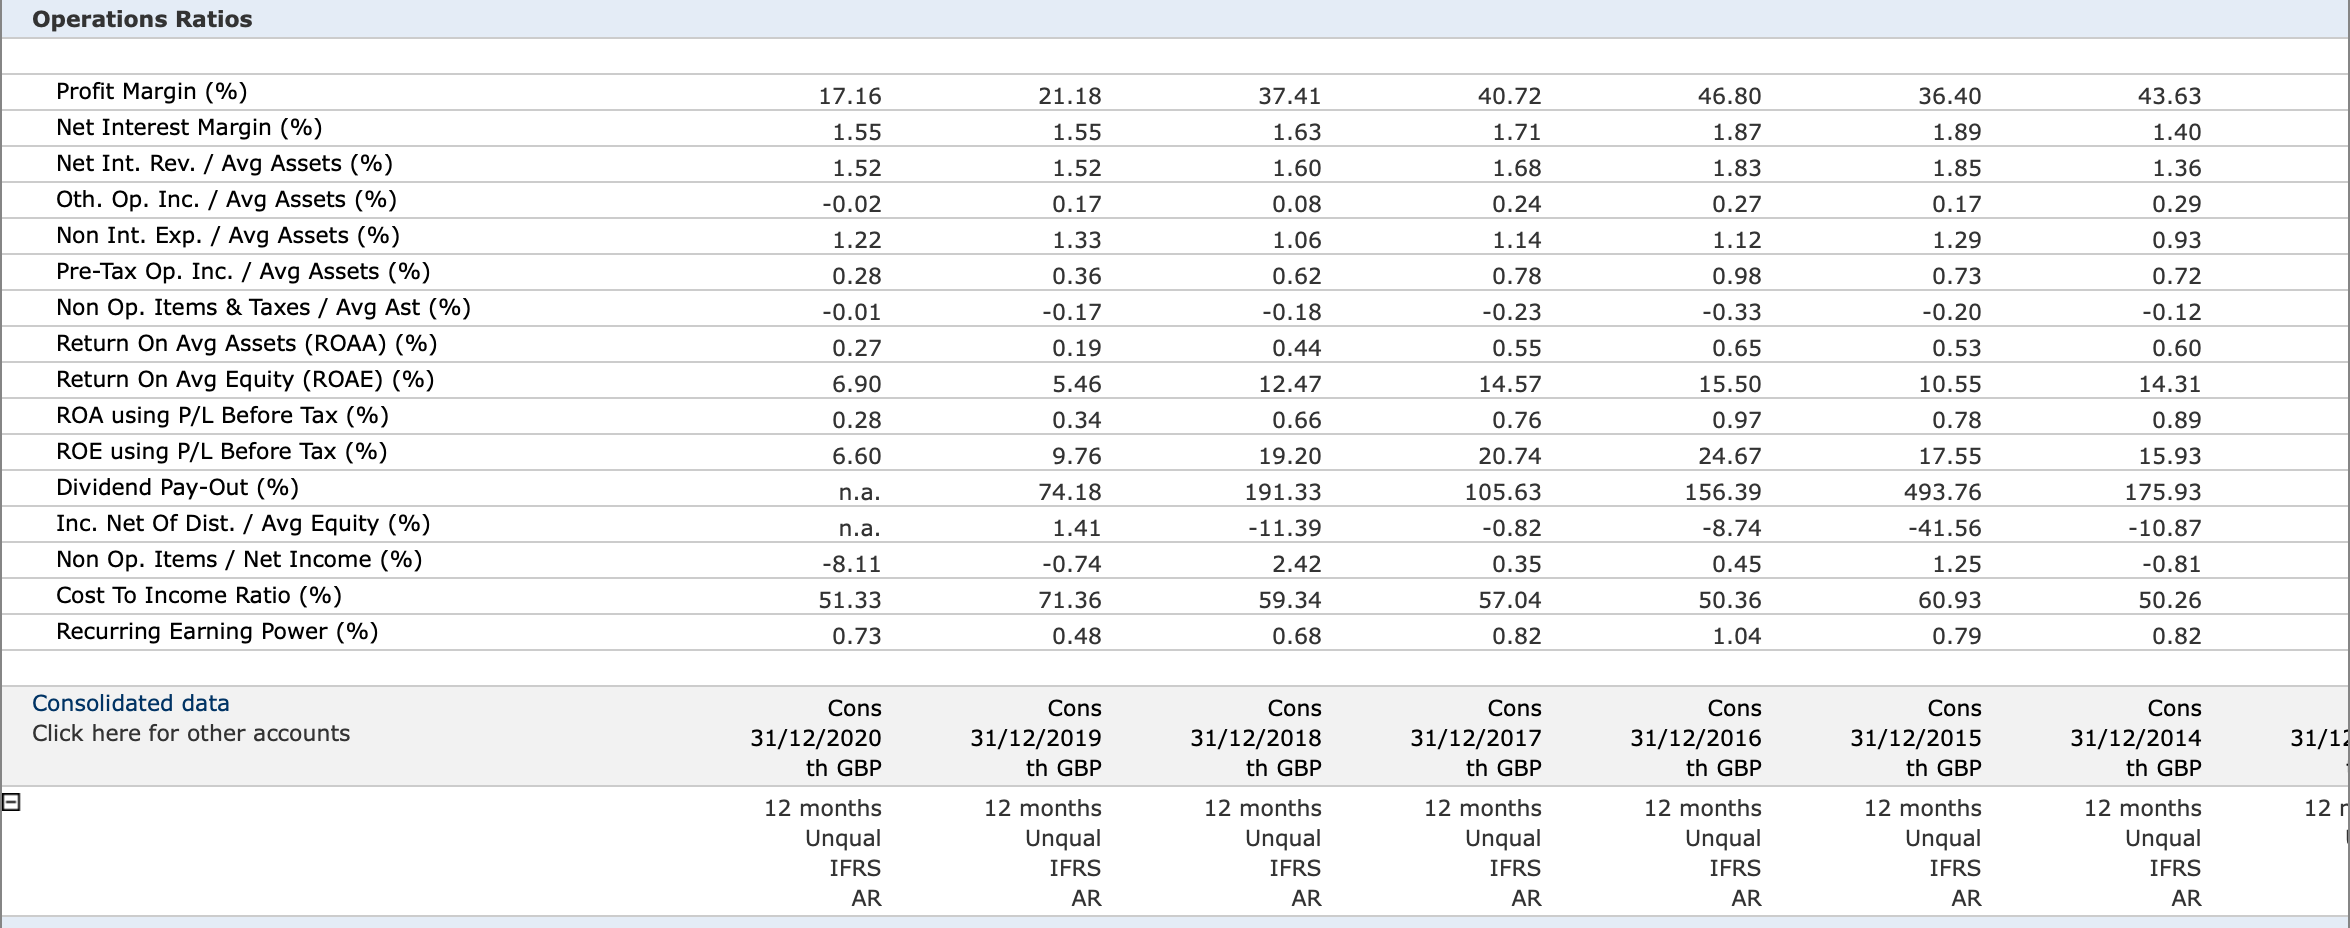

This information is data from the Bank of scotland PLC and shows all their current data for the consecutive years that have passed, study the data and conclude as to what changes have been made within the past years and the current state in regards to interest rate risk, calculate the interest rate risk using the data provided
Consolidated data Click here for other accounts Cons 31/12/2020 th GBP Cons 31/12/2019 th GBP Cons 31/12/2018 th GBP Cons 31/12/2017 th GBP Cons 31/12/2016 th GBP Cons 31/12/2015 th GBP Columns Cons 31/12/2014 th GBP 31/12 a 12r 12 months Unqual IFRS AR 12 months Unqual IFRS AR 12 months Unqual IFRS AR 12 months Unqual IFRS AR 12 months Unqual IFRS AR 12 months Unqual IFRS AR 12 months Unqual IFRS AR Total Assets Shareholders Funds Operating Rev./Turnover P/L before Taxation Net Income Market Cap. 310,328,000 13,388,000 5,147,000 883,000 913,000 375,774,000 13,090,000 6,033,000 1,278,000 674,000 338,748,000 11,620,000 5,964,000 2,231,000 1,568,000 370,072,000 13,520,000 6,886,000 2,804,000 1,988,000 348,685,000 13,763,000 7,255,000 3,395,000 2,238,000 341,333,000 15,119,000 7,288,000 2,653,000 1,924,000 381,130,000 21,343,000 7,793,000 3,400,000 2,842,000 n.a. 568,4 18,3 7,6 1,4 3 n.a. n.a. n.a. n.a. n.a. n.a. Number of employees 27,258 29,238 31,503 33,907 35,752 36,351 40,148 Assets Loans Gross Loans Less: Reserves for Impaired Loans/ NPLs Other Earning Assets Loans and Advances to Banks Derivatives (Assets) Other Securities Remaining earning assets Total Earning Assets Fixed Assets Non-Earning Assets 264,243,000 267,435,000 3,192,000 39,060,000 29,237,000 7,423,000 2,396,000 4,000 303,303,000 1,226,000 5,799,000 258,778,000 260,863,000 2,085,000 110,492,000 97,885,000 10,338,000 2,254,000 15,000 369,270,000 1,392,000 5,112,000 262,833,000 264,948,000 2,115,000 69,949,000 59,584,000 9,361,000 969,000 35,000 332,782,000 742,000 5,224,000 268,657,000 270,782,000 2,125,000 95,082,000 82,441,000 11,634,000 1,007,000 268,899,000 271,284,000 2,385,000 72,943,000 53,996,000 14,664,000 4,180,000 103,000 341,842,000 1,003,000 5,840,000 270,837,000 273,647,000 2,810,000 63,792,000 39,617,000 14,926,000 9,138,000 111,000 334,629,000 1,081,000 5,623,000 271,674,000 277,357,000 5,683,000 98,820,000 55,482,000 23,487,000 19,673,000 178,000 370,494,000 1,139,000 9,497,000 283,6 296,5 12,8 269,8 207,2 20,8 41,0 6 553,5 1,4 13,4 n.a. 363,739,000 823,000 5,510,000 Total Assets 310,328,000 375,774,000 338,748,000 370,072,000 348,685,000 341,333,000 381,130,000 568,4 Consolidated data Click here for other accounts Cons 31/12/2020 th GBP Cons 31/12/2019 th GBP Cons 31/12/2018 th GBP Cons 31/12/2017 th GBP Cons 31/12/2016 th GBP Cons 31/12/2015 th GBP Cons 31/12/2014 th GBP 31/12 12 r 12 months Unqual IFRS AR 12 months Unqual IFRS AR 12 months Unqual IFRS AR 12 months Unqual IFRS AR 12 months Unqual IFRS AR 12 months Unqual IFRS AR 12 months Unqual IFRS AR Liabilities & Equity 269,747,000 163,001,000 106,746,000 330,078,000 151,845,000 178,233,000 295,092,000 162,141,000 132,951,000 323,152,000 171,198,000 151,954,000 292,562,000 179,317,000 113,245,000 282,616,000 190,046,000 92,570,000 306,001,000 203,498,000 102,503,000 474,1 206,5 267,5 na. n.a. n.a. n.a. n.a. n.a. n.a. Deposits & Short Term Funding Total Customer Deposits Deposits from Banks Other Deposits and Short-term Borrowings Other interest bearing liabilities Derivatives (Liabilities) Trading Liabilities Long term funding Other (Non-Interest bearing) Reserves Equity 24,677,000 8,672,000 45,000 15,960,000 1,995,000 521,000 13,388,000 29,474,000 11,352,000 47,000 18,075,000 2,155,000 977,000 13,090,000 28,947,000 10,208,000 103,000 18,636,000 2,062,000 1,027,000 11,620,000 29,044,000 11,026,000 50,000 17,968,000 2,337,000 2,019,000 13,520,000 37,490,000 13,725,000 2,000 23,763,000 3,024,000 1,846,000 13,763,000 39,182,000 13,329,000 1,000 25,852,000 2,517,000 1,899,000 15,119,000 49,497,000 21,410,000 52,000 28,035,000 2,743,000 1,546,000 21,343,000 68,2 20,3 5,00 42,8 6,2 1,4 18,3 Total Liabilities & Equity 310,328,000 375,774,000 338,748,000 370,072,000 348,685,000 341,333,000 381,130,000 568,4 Consolidated data Click here for other accounts Cons 31/12/2020 th GBP Cons 31/12/2019 th GBP Cons 31/12/2018 th GBP Cons 31/12/2015 th GBP 31/12 12 months Unqual IFRS AR 12 months Unqual IFRS AR Cons 31/12/2017 th GBP 12 months Unqual IFRS AR 12 months Unqual IFRS AR 12r Cons 31/12/2016 th GBP 12 months Unqual IFRS AR Cons 31/12/2014 th GBP 12 months Unqual IFRS AR 12 months Unqual IFRS AR Notes Impaired Loans (Memo) Loan Loss Reserves (Memo) Liquid Assets (Memo) Intangibles (Memo) Off Balance Sheet Items 5,775,000 3,192,000 32,330,000 549,000 47,779,000 5,663,000 2,085,000 100,855,000 463,000 38,132,000 6,143,000 2,115,000 61,393,000 445,000 36,571,000 4,991,000 2,125,000 84,746,000 437,000 35,695,000 5,759,000 2,385,000 57,443,000 425,000 36,295,000 6,053,000 2,810,000 46,102,000 427,000 35,248,000 9,832,000 5,683,000 74,065,000 425,000 33,595,000 25,0 12,8 251,4 41 33,2 n.a. n.a. n.a. n.a. n.a. n.a. n.a. Hybrid Capital (Memo) Subordinated Debts (Memo) 6,964,000 6,101,000 6,775,000 7,049,000 7,084,000 7,360,000 7,627,000 13,3 Consolidated data Click here for other accounts Cons 31/12/2020 th GBP Cons 31/12/2019 th GBP Cons 31/12/2018 th GBP Cons 31/12/2017 th GBP Cons 31/12/2016 th GBP Cons 31/12/2015 th GBP Cons 31/12/2014 th GBP 31/12 12 12 months Unqual IFRS AR 12 months Unqual IFRS AR 12 months Unqual IFRS AR 12 months Unqual IFRS AR 12 months Unqual IFRS AR 12 months Unqual IFRS AR 12 months Unqual IFRS AR Income statement 5,208,000 -61,000 -349,000 6,7 8 -4 na. 2 Net Interest Revenue Other Operating Income Net Gains (Losses) on Trading and Derivatives Net Gains (Losses) on Assets at FV through Income ... Net Fees and Commissions Remaining Operating Income Overheads Loan Loss Provisions 6 3 5,428,000 605,000 254,000 -1,000 320,000 32,000 4,305,000 445,000 -5,000 1,278,000 604,000 674,000 199,000 89,000 2,642,000 1,548,000 -74,000 883,000 -30,000 913,000 5,683,000 281,000 7,000 10,000 205,000 59,000 3,539,000 232,000 38,000 2,231,000 663,000 1,568,000 6,020,000 873,000 202,000 14,000 368,000 289,000 3,932,000 164,000 7,000 2,804,000 816,000 1,988,000 6,330,000 924,000 189,000 -1,000 409,000 327,000 3,653,000 216,000 10,000 3,395,000 1,157,000 2,238,000 6,668,000 617,000 -89,000 175,000 465,000 66,000 4,439,000 217,000 24,000 2,653,000 729,000 1,924,000 6,445,000 1,380,000 203,000 561,000 537,000 79,000 3,933,000 469,000 -23,000 3,400,000 558,000 2,842,000 3,7 2,4 Other Profit before Tax Tax 1,4 1,0 3 Net Income Operating Income (Memo) 5,147,000 6,033,000 5,964,000 6,893,000 7,254,000 7,285,000 7,825,000 7,6 Dividend Paid n.a. 500,000 3,000,000 2,100,000 3,500,000 9,500,000 5,000,000 21.20 19.80 20.60 22.40 22.50 19.10 18.40 15.30 14.50 14.60 Total Capital Ratio% Tier 1 Ratio% Total Capital Tier 1 Capital Net-Charge Offs 12,966,000 11,710,000 12,277,000 11,406,000 12,711,000 9,464,000 21.30 15.00 14,185,000 9,957,000 438,000 23.20 14.50 17,496,000 10,924,000 675,000 17,021,000 11,001,000 2,895,000 20,409,000 13,195,000 7,249,000 27,9 17,4 7,4 n.a. n.a. n.a. Assets Quality Ratios 1.19 0.80 0.88 1.03 2.05 0.80 4.08 0.79 2.72 29.72 3.41 3.25 7.28 8.20 36.82 55.27 34.43 42.58 41.41 46.42 57.80 3.54 2.16 2.17 2.32 1.84 2.12 2.21 Loan Loss Res. / Gross Loans (%) Loan Loss Prov. / Net Int. Rev. (%) Loan Loss Res. / Impaired Loans (%) Impaired Loans / Gross Loans (%) NCO / Average Gross Loans (%) NCO / Net Inc. Bef. In Lss Prov. (%) Impaired Loans / Equity (%) Unreserved Impaired Loans / Equity (%) n.a. n.a. n.a. 0.16 1.05 2.53 0.25 27.51 n.a. n.a. n.a. 20.35 135.22 218.94 46.07 43.26 52.87 41.84 40.04 43.14 19.29 36.92 21.20 27.33 34.66 24.52 21.45 19.44 Consolidated data Click here for other accounts Cons 31/12/2020 th GBP Cons 31/12/2019 th GBP Cons 31/12/2018 th GBP Cons 31/12/2017 th GBP Cons 31/12/2016 th GBP Cons 31/12/2015 th GBP Cons 31/12/2014 th GBP 31/12 12 months 12 months 12 months 12 months 12 months 12 months 12 months 12 r Capital Ratios 18.40 19.10 21.20 4.31 15.30 20.60 3.43 14.50 23.20 19.80 14.60 22.50 14.50 22.40 4.43 15.00 21.30 3.65 5.03 4.18 3.48 5.06 5.07 4.42 5.58 3.97 Tier 1 Ratio (%) Total Capital Ratio (%) Equity / Tot. Assets (%) Equity / Net Loans (%) Equity / Cust & short term funding (%) Equity / Liabilities (%) Cap. Funds / Tot. Assets (%) Cap. Funds / Net Loans (%) Cap. Funds / Dep. & ST Funding (%) Cap. Funds / Liabilities (%) Subord Debt / Cap. Funds (%) 5.35 4.96 4.62 6.56 3.95 5.12 4.70 4.20 5.98 3.94 3.63 5.43 5.60 7.86 6.98 6.06 7.60 10.66 3.87 3.67 5.11 7.42 4.74 5.56 6.59 8.30 7.70 7.00 7.66 7.75 6.36 7.13 9.47 7.54 7.02 34.22 5.81 5.38 31.79 6.23 5.74 5.88 6.36 7.95 7.05 32.74 8.23 26.33 36.83 34.27 33.98 Consolidated data Click here for other accounts Cons 31/12/2020 th GBP Cons 31/12/2019 th GBP Cons 31/12/2018 th GBP Cons 31/12/2017 th GBP Cons 31/12/2016 th GBP Cons 31/12/2015 th GBP Cons 31/12/2014 th GBP 31/12 12 12 months Unqual IFRS AR 12 months Unqual IFRS AR 12 months Unqual IFRS AR 12 months Unqual IFRS AR 12 months Unqual IFRS AR 12 months Unqual IFRS AR 12 months Unqual IFRS AR Operations Ratios 17.16 21.18 40.72 46.80 36.40 43.63 37.41 1.63 1.55 1.71 1.87 1.55 1.52 1.89 1.85 1.52 1.60 1.68 0.24 1.83 0.27 1.40 1.36 0.29 -0.02 0.17 0.08 0.17 1.22 1.33 1.12 0.28 0.36 -0.17 1.06 0.62 -0.18 1.14 0.78 -0.23 0.98 -0.33 0.65 1.29 0.73 -0.20 0.93 0.72 -0.12 0.44 0.55 0.53 0.60 Profit Margin (%) Net Interest Margin (%) Net Int. Rev. / Avg Assets (%) Oth. Op. Inc. / Avg Assets (%) Non Int. Exp. / Avg Assets (%) Pre-Tax Op. Inc. / Avg Assets (%) Non Op. Items & Taxes / Avg Ast (%) Return On Avg Assets (ROAA) (%) Return On Avg Equity (ROAE) (%) ROA using P/L Before Tax (%) ROE using P/L Before Tax (%) Dividend Pay-Out (%) Inc. Net Of Dist. / Avg Equity (%) Non Op. Items / Net Income (%) Cost To Income Ratio (%) Recurring Earning Power (%) -0.01 0.27 6.90 0.28 6.60 0.19 5.46 12.47 14.57 0.76 0.34 9.76 74.18 20.74 0.66 19.20 191.33 -11.39 10.55 0.78 17.55 493.76 -41.56 1.25 n.a. 15.50 0.97 24.67 156.39 -8.74 0.45 50.36 105.63 14.31 0.89 15.93 175.93 -10.87 -0.81 50.26 n.a. 1.41 -0.82 0.35 -8.11 -0.74 71.36 51.33 2.42 59.34 0.68 57.04 60.93 0.73 0.48 0.82 1.04 0.79 0.82 Consolidated data Click here for other accounts Cons 31/12/2020 th GBP Cons 31/12/2019 th GBP Cons 31/12/2018 th GBP Cons 31/12/2017 th GBP Cons 31/12/2016 th GBP Cons 31/12/2015 th GBP Cons 31/12/2014 th GBP 31/12 12 r 12 months Unqual IFRS AR 12 months Unqual IFRS AR 12 months Unqual IFRS AR 12 months Unqual IFRS AR 12 months Unqual IFRS AR 12 months Unqual IFRS AR 12 months Unqual IFRS AR Liquidity Ratios 54.92 54.25 47.68 42.80 27.39 85.15 44.82 77.59 54.13 71.28 77.12 79.35 68.86 78.40 72.60 83.14 97.96 89.07 95.83 88.78 Interbank Ratio (%) Net Loans / Tot. Assets (%) Net Loans / Dep. & ST Funding (%) Net Loans / Tot. Dep. & Bor. (%) Liquid Assets / Dep. & ST Funding (%) Liquid Assets / Tot. Dep. & Bor. (%) Current ratio% 91.91 83.26 91.92 73.22 82.84 77.84 86.13 78.10 11.99 30.55 20.80 26.22 16.31 24.20 19.63 17.79 11.25 28.53 19.35 24.55 14.66 21.29 11.99 30.55 20.80 26.22 19.63 16.31 24.20 Consolidated data Click here for other accounts Cons 31/12/2020 th GBP Cons 31/12/2019 th GBP Cons 31/12/2018 th GBP Cons 31/12/2017 th GBP Cons 31/12/2016 th GBP Cons 31/12/2015 th GBP Cons 31/12/2014 th GBP 31/12 12 r 12 months Unqual IFRS AR 12 months Unqual IFRS AR 12 months Unqual IFRS 12 months Unqual IFRS AR 12 months Unqual IFRS AR 12 months Unqual IFRS AR 12 months Unqual IFRS AR AR Structure Ratio Solvency ratio (%) 4.31 3.48 3.43 3.65 3.95 4.43 5.60 Consolidated data Click here for other accounts Cons 31/12/2020 th GBP Cons 31/12/2019 th GBP Cons 31/12/2018 th GBP Cons 31/12/2017 th GBP Cons 31/12/2016 th GBP Cons 31/12/2015 th GBP Columns Cons 31/12/2014 th GBP 31/12 a 12r 12 months Unqual IFRS AR 12 months Unqual IFRS AR 12 months Unqual IFRS AR 12 months Unqual IFRS AR 12 months Unqual IFRS AR 12 months Unqual IFRS AR 12 months Unqual IFRS AR Total Assets Shareholders Funds Operating Rev./Turnover P/L before Taxation Net Income Market Cap. 310,328,000 13,388,000 5,147,000 883,000 913,000 375,774,000 13,090,000 6,033,000 1,278,000 674,000 338,748,000 11,620,000 5,964,000 2,231,000 1,568,000 370,072,000 13,520,000 6,886,000 2,804,000 1,988,000 348,685,000 13,763,000 7,255,000 3,395,000 2,238,000 341,333,000 15,119,000 7,288,000 2,653,000 1,924,000 381,130,000 21,343,000 7,793,000 3,400,000 2,842,000 n.a. 568,4 18,3 7,6 1,4 3 n.a. n.a. n.a. n.a. n.a. n.a. Number of employees 27,258 29,238 31,503 33,907 35,752 36,351 40,148 Assets Loans Gross Loans Less: Reserves for Impaired Loans/ NPLs Other Earning Assets Loans and Advances to Banks Derivatives (Assets) Other Securities Remaining earning assets Total Earning Assets Fixed Assets Non-Earning Assets 264,243,000 267,435,000 3,192,000 39,060,000 29,237,000 7,423,000 2,396,000 4,000 303,303,000 1,226,000 5,799,000 258,778,000 260,863,000 2,085,000 110,492,000 97,885,000 10,338,000 2,254,000 15,000 369,270,000 1,392,000 5,112,000 262,833,000 264,948,000 2,115,000 69,949,000 59,584,000 9,361,000 969,000 35,000 332,782,000 742,000 5,224,000 268,657,000 270,782,000 2,125,000 95,082,000 82,441,000 11,634,000 1,007,000 268,899,000 271,284,000 2,385,000 72,943,000 53,996,000 14,664,000 4,180,000 103,000 341,842,000 1,003,000 5,840,000 270,837,000 273,647,000 2,810,000 63,792,000 39,617,000 14,926,000 9,138,000 111,000 334,629,000 1,081,000 5,623,000 271,674,000 277,357,000 5,683,000 98,820,000 55,482,000 23,487,000 19,673,000 178,000 370,494,000 1,139,000 9,497,000 283,6 296,5 12,8 269,8 207,2 20,8 41,0 6 553,5 1,4 13,4 n.a. 363,739,000 823,000 5,510,000 Total Assets 310,328,000 375,774,000 338,748,000 370,072,000 348,685,000 341,333,000 381,130,000 568,4 Consolidated data Click here for other accounts Cons 31/12/2020 th GBP Cons 31/12/2019 th GBP Cons 31/12/2018 th GBP Cons 31/12/2017 th GBP Cons 31/12/2016 th GBP Cons 31/12/2015 th GBP Cons 31/12/2014 th GBP 31/12 12 r 12 months Unqual IFRS AR 12 months Unqual IFRS AR 12 months Unqual IFRS AR 12 months Unqual IFRS AR 12 months Unqual IFRS AR 12 months Unqual IFRS AR 12 months Unqual IFRS AR Liabilities & Equity 269,747,000 163,001,000 106,746,000 330,078,000 151,845,000 178,233,000 295,092,000 162,141,000 132,951,000 323,152,000 171,198,000 151,954,000 292,562,000 179,317,000 113,245,000 282,616,000 190,046,000 92,570,000 306,001,000 203,498,000 102,503,000 474,1 206,5 267,5 na. n.a. n.a. n.a. n.a. n.a. n.a. Deposits & Short Term Funding Total Customer Deposits Deposits from Banks Other Deposits and Short-term Borrowings Other interest bearing liabilities Derivatives (Liabilities) Trading Liabilities Long term funding Other (Non-Interest bearing) Reserves Equity 24,677,000 8,672,000 45,000 15,960,000 1,995,000 521,000 13,388,000 29,474,000 11,352,000 47,000 18,075,000 2,155,000 977,000 13,090,000 28,947,000 10,208,000 103,000 18,636,000 2,062,000 1,027,000 11,620,000 29,044,000 11,026,000 50,000 17,968,000 2,337,000 2,019,000 13,520,000 37,490,000 13,725,000 2,000 23,763,000 3,024,000 1,846,000 13,763,000 39,182,000 13,329,000 1,000 25,852,000 2,517,000 1,899,000 15,119,000 49,497,000 21,410,000 52,000 28,035,000 2,743,000 1,546,000 21,343,000 68,2 20,3 5,00 42,8 6,2 1,4 18,3 Total Liabilities & Equity 310,328,000 375,774,000 338,748,000 370,072,000 348,685,000 341,333,000 381,130,000 568,4 Consolidated data Click here for other accounts Cons 31/12/2020 th GBP Cons 31/12/2019 th GBP Cons 31/12/2018 th GBP Cons 31/12/2015 th GBP 31/12 12 months Unqual IFRS AR 12 months Unqual IFRS AR Cons 31/12/2017 th GBP 12 months Unqual IFRS AR 12 months Unqual IFRS AR 12r Cons 31/12/2016 th GBP 12 months Unqual IFRS AR Cons 31/12/2014 th GBP 12 months Unqual IFRS AR 12 months Unqual IFRS AR Notes Impaired Loans (Memo) Loan Loss Reserves (Memo) Liquid Assets (Memo) Intangibles (Memo) Off Balance Sheet Items 5,775,000 3,192,000 32,330,000 549,000 47,779,000 5,663,000 2,085,000 100,855,000 463,000 38,132,000 6,143,000 2,115,000 61,393,000 445,000 36,571,000 4,991,000 2,125,000 84,746,000 437,000 35,695,000 5,759,000 2,385,000 57,443,000 425,000 36,295,000 6,053,000 2,810,000 46,102,000 427,000 35,248,000 9,832,000 5,683,000 74,065,000 425,000 33,595,000 25,0 12,8 251,4 41 33,2 n.a. n.a. n.a. n.a. n.a. n.a. n.a. Hybrid Capital (Memo) Subordinated Debts (Memo) 6,964,000 6,101,000 6,775,000 7,049,000 7,084,000 7,360,000 7,627,000 13,3 Consolidated data Click here for other accounts Cons 31/12/2020 th GBP Cons 31/12/2019 th GBP Cons 31/12/2018 th GBP Cons 31/12/2017 th GBP Cons 31/12/2016 th GBP Cons 31/12/2015 th GBP Cons 31/12/2014 th GBP 31/12 12 12 months Unqual IFRS AR 12 months Unqual IFRS AR 12 months Unqual IFRS AR 12 months Unqual IFRS AR 12 months Unqual IFRS AR 12 months Unqual IFRS AR 12 months Unqual IFRS AR Income statement 5,208,000 -61,000 -349,000 6,7 8 -4 na. 2 Net Interest Revenue Other Operating Income Net Gains (Losses) on Trading and Derivatives Net Gains (Losses) on Assets at FV through Income ... Net Fees and Commissions Remaining Operating Income Overheads Loan Loss Provisions 6 3 5,428,000 605,000 254,000 -1,000 320,000 32,000 4,305,000 445,000 -5,000 1,278,000 604,000 674,000 199,000 89,000 2,642,000 1,548,000 -74,000 883,000 -30,000 913,000 5,683,000 281,000 7,000 10,000 205,000 59,000 3,539,000 232,000 38,000 2,231,000 663,000 1,568,000 6,020,000 873,000 202,000 14,000 368,000 289,000 3,932,000 164,000 7,000 2,804,000 816,000 1,988,000 6,330,000 924,000 189,000 -1,000 409,000 327,000 3,653,000 216,000 10,000 3,395,000 1,157,000 2,238,000 6,668,000 617,000 -89,000 175,000 465,000 66,000 4,439,000 217,000 24,000 2,653,000 729,000 1,924,000 6,445,000 1,380,000 203,000 561,000 537,000 79,000 3,933,000 469,000 -23,000 3,400,000 558,000 2,842,000 3,7 2,4 Other Profit before Tax Tax 1,4 1,0 3 Net Income Operating Income (Memo) 5,147,000 6,033,000 5,964,000 6,893,000 7,254,000 7,285,000 7,825,000 7,6 Dividend Paid n.a. 500,000 3,000,000 2,100,000 3,500,000 9,500,000 5,000,000 21.20 19.80 20.60 22.40 22.50 19.10 18.40 15.30 14.50 14.60 Total Capital Ratio% Tier 1 Ratio% Total Capital Tier 1 Capital Net-Charge Offs 12,966,000 11,710,000 12,277,000 11,406,000 12,711,000 9,464,000 21.30 15.00 14,185,000 9,957,000 438,000 23.20 14.50 17,496,000 10,924,000 675,000 17,021,000 11,001,000 2,895,000 20,409,000 13,195,000 7,249,000 27,9 17,4 7,4 n.a. n.a. n.a. Assets Quality Ratios 1.19 0.80 0.88 1.03 2.05 0.80 4.08 0.79 2.72 29.72 3.41 3.25 7.28 8.20 36.82 55.27 34.43 42.58 41.41 46.42 57.80 3.54 2.16 2.17 2.32 1.84 2.12 2.21 Loan Loss Res. / Gross Loans (%) Loan Loss Prov. / Net Int. Rev. (%) Loan Loss Res. / Impaired Loans (%) Impaired Loans / Gross Loans (%) NCO / Average Gross Loans (%) NCO / Net Inc. Bef. In Lss Prov. (%) Impaired Loans / Equity (%) Unreserved Impaired Loans / Equity (%) n.a. n.a. n.a. 0.16 1.05 2.53 0.25 27.51 n.a. n.a. n.a. 20.35 135.22 218.94 46.07 43.26 52.87 41.84 40.04 43.14 19.29 36.92 21.20 27.33 34.66 24.52 21.45 19.44 Consolidated data Click here for other accounts Cons 31/12/2020 th GBP Cons 31/12/2019 th GBP Cons 31/12/2018 th GBP Cons 31/12/2017 th GBP Cons 31/12/2016 th GBP Cons 31/12/2015 th GBP Cons 31/12/2014 th GBP 31/12 12 months 12 months 12 months 12 months 12 months 12 months 12 months 12 r Capital Ratios 18.40 19.10 21.20 4.31 15.30 20.60 3.43 14.50 23.20 19.80 14.60 22.50 14.50 22.40 4.43 15.00 21.30 3.65 5.03 4.18 3.48 5.06 5.07 4.42 5.58 3.97 Tier 1 Ratio (%) Total Capital Ratio (%) Equity / Tot. Assets (%) Equity / Net Loans (%) Equity / Cust & short term funding (%) Equity / Liabilities (%) Cap. Funds / Tot. Assets (%) Cap. Funds / Net Loans (%) Cap. Funds / Dep. & ST Funding (%) Cap. Funds / Liabilities (%) Subord Debt / Cap. Funds (%) 5.35 4.96 4.62 6.56 3.95 5.12 4.70 4.20 5.98 3.94 3.63 5.43 5.60 7.86 6.98 6.06 7.60 10.66 3.87 3.67 5.11 7.42 4.74 5.56 6.59 8.30 7.70 7.00 7.66 7.75 6.36 7.13 9.47 7.54 7.02 34.22 5.81 5.38 31.79 6.23 5.74 5.88 6.36 7.95 7.05 32.74 8.23 26.33 36.83 34.27 33.98 Consolidated data Click here for other accounts Cons 31/12/2020 th GBP Cons 31/12/2019 th GBP Cons 31/12/2018 th GBP Cons 31/12/2017 th GBP Cons 31/12/2016 th GBP Cons 31/12/2015 th GBP Cons 31/12/2014 th GBP 31/12 12 12 months Unqual IFRS AR 12 months Unqual IFRS AR 12 months Unqual IFRS AR 12 months Unqual IFRS AR 12 months Unqual IFRS AR 12 months Unqual IFRS AR 12 months Unqual IFRS AR Operations Ratios 17.16 21.18 40.72 46.80 36.40 43.63 37.41 1.63 1.55 1.71 1.87 1.55 1.52 1.89 1.85 1.52 1.60 1.68 0.24 1.83 0.27 1.40 1.36 0.29 -0.02 0.17 0.08 0.17 1.22 1.33 1.12 0.28 0.36 -0.17 1.06 0.62 -0.18 1.14 0.78 -0.23 0.98 -0.33 0.65 1.29 0.73 -0.20 0.93 0.72 -0.12 0.44 0.55 0.53 0.60 Profit Margin (%) Net Interest Margin (%) Net Int. Rev. / Avg Assets (%) Oth. Op. Inc. / Avg Assets (%) Non Int. Exp. / Avg Assets (%) Pre-Tax Op. Inc. / Avg Assets (%) Non Op. Items & Taxes / Avg Ast (%) Return On Avg Assets (ROAA) (%) Return On Avg Equity (ROAE) (%) ROA using P/L Before Tax (%) ROE using P/L Before Tax (%) Dividend Pay-Out (%) Inc. Net Of Dist. / Avg Equity (%) Non Op. Items / Net Income (%) Cost To Income Ratio (%) Recurring Earning Power (%) -0.01 0.27 6.90 0.28 6.60 0.19 5.46 12.47 14.57 0.76 0.34 9.76 74.18 20.74 0.66 19.20 191.33 -11.39 10.55 0.78 17.55 493.76 -41.56 1.25 n.a. 15.50 0.97 24.67 156.39 -8.74 0.45 50.36 105.63 14.31 0.89 15.93 175.93 -10.87 -0.81 50.26 n.a. 1.41 -0.82 0.35 -8.11 -0.74 71.36 51.33 2.42 59.34 0.68 57.04 60.93 0.73 0.48 0.82 1.04 0.79 0.82 Consolidated data Click here for other accounts Cons 31/12/2020 th GBP Cons 31/12/2019 th GBP Cons 31/12/2018 th GBP Cons 31/12/2017 th GBP Cons 31/12/2016 th GBP Cons 31/12/2015 th GBP Cons 31/12/2014 th GBP 31/12 12 r 12 months Unqual IFRS AR 12 months Unqual IFRS AR 12 months Unqual IFRS AR 12 months Unqual IFRS AR 12 months Unqual IFRS AR 12 months Unqual IFRS AR 12 months Unqual IFRS AR Liquidity Ratios 54.92 54.25 47.68 42.80 27.39 85.15 44.82 77.59 54.13 71.28 77.12 79.35 68.86 78.40 72.60 83.14 97.96 89.07 95.83 88.78 Interbank Ratio (%) Net Loans / Tot. Assets (%) Net Loans / Dep. & ST Funding (%) Net Loans / Tot. Dep. & Bor. (%) Liquid Assets / Dep. & ST Funding (%) Liquid Assets / Tot. Dep. & Bor. (%) Current ratio% 91.91 83.26 91.92 73.22 82.84 77.84 86.13 78.10 11.99 30.55 20.80 26.22 16.31 24.20 19.63 17.79 11.25 28.53 19.35 24.55 14.66 21.29 11.99 30.55 20.80 26.22 19.63 16.31 24.20 Consolidated data Click here for other accounts Cons 31/12/2020 th GBP Cons 31/12/2019 th GBP Cons 31/12/2018 th GBP Cons 31/12/2017 th GBP Cons 31/12/2016 th GBP Cons 31/12/2015 th GBP Cons 31/12/2014 th GBP 31/12 12 r 12 months Unqual IFRS AR 12 months Unqual IFRS AR 12 months Unqual IFRS 12 months Unqual IFRS AR 12 months Unqual IFRS AR 12 months Unqual IFRS AR 12 months Unqual IFRS AR AR Structure Ratio Solvency ratio (%) 4.31 3.48 3.43 3.65 3.95 4.43 5.60


