

Answered step by step
Verified Expert Solution
Question
1 Approved Answer
As a talent development executive at a commercial bank, Jillian Herbet was tasked with training first-year analysts. With each new class, Jillian worked to
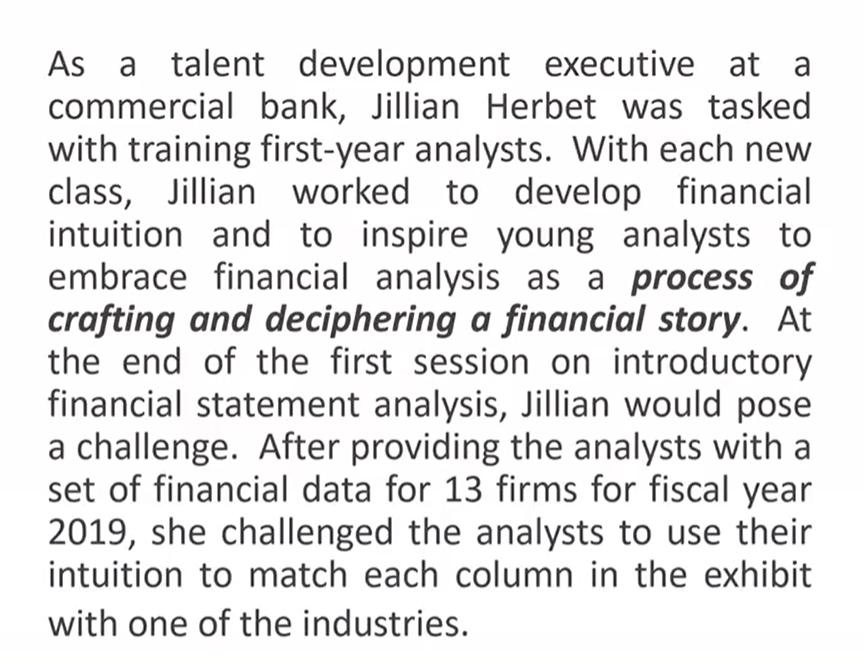
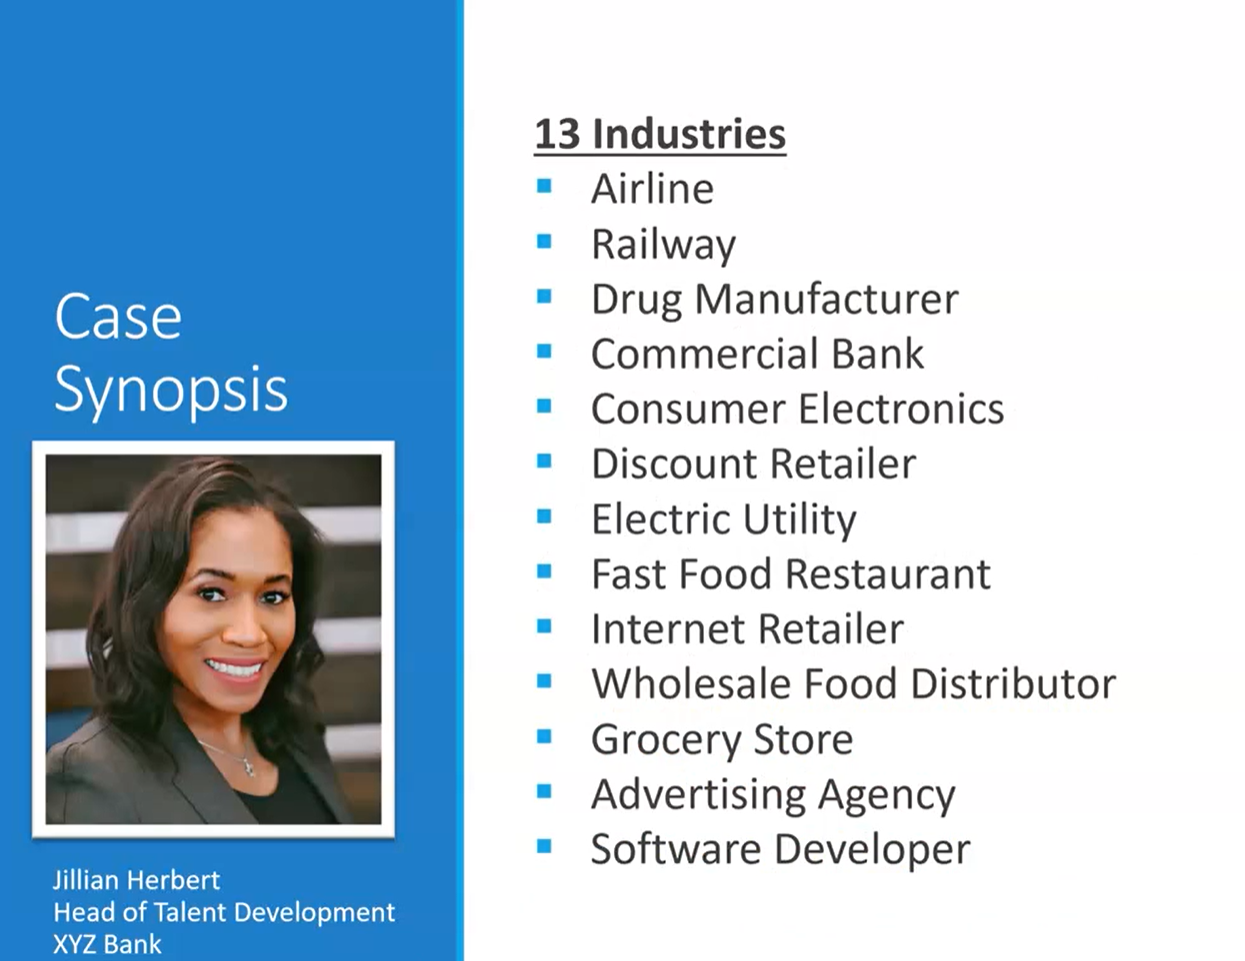
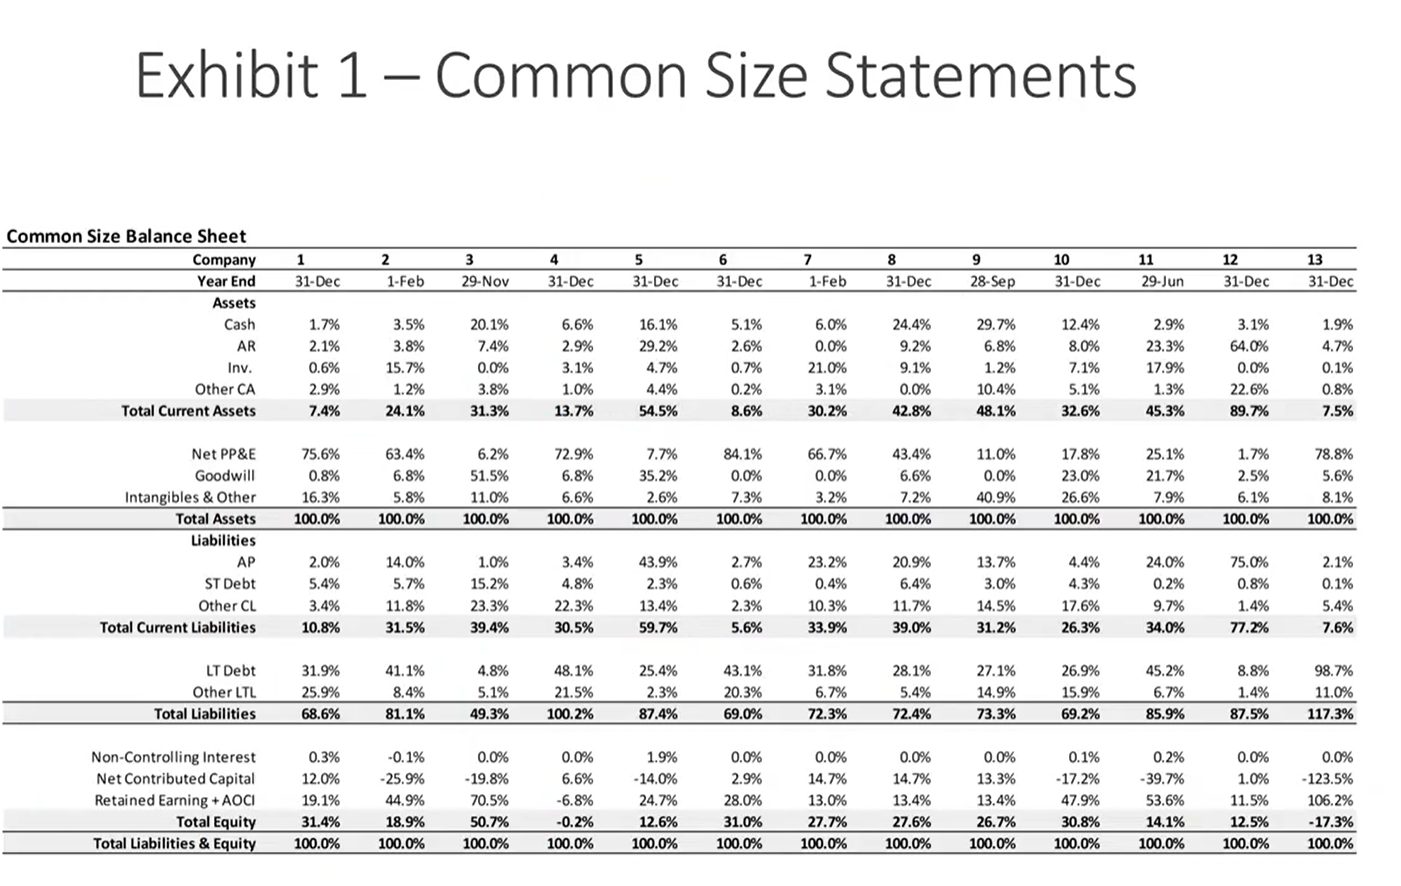
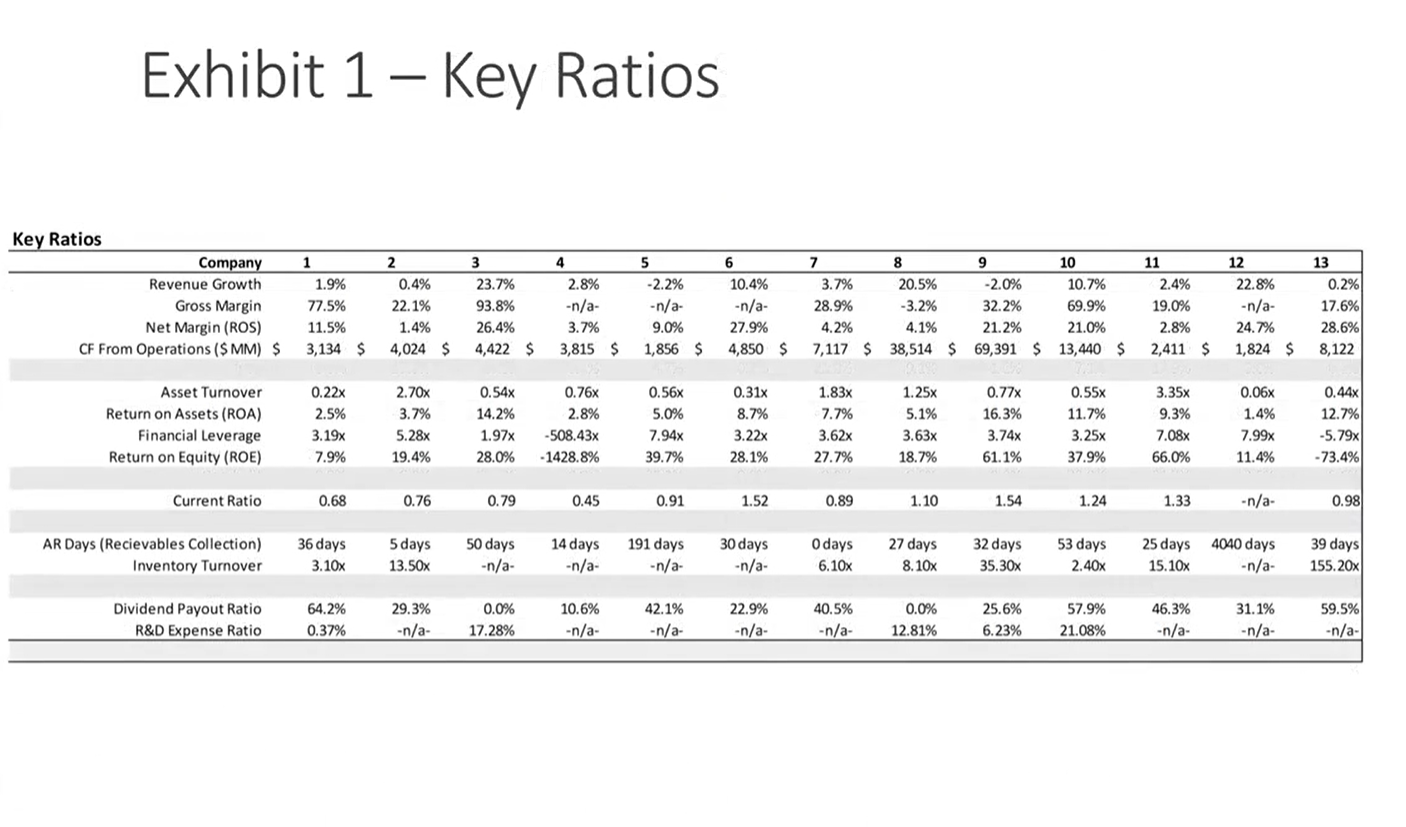
As a talent development executive at a commercial bank, Jillian Herbet was tasked with training first-year analysts. With each new class, Jillian worked to develop financial intuition and to inspire young analysts to embrace financial analysis as a process of crafting and deciphering a financial story. At the end of the first session on introductory financial statement analysis, Jillian would pose a challenge. After providing the analysts with a set of financial data for 13 firms for fiscal year 2019, she challenged the analysts to use their intuition to match each column in the exhibit with one of the industries. Case Synopsis Jillian Herbert Head of Talent Development XYZ Bank 13 Industries Airline Railway Drug Manufacturer Commercial Bank Consumer Electronics Discount Retailer Electric Utility Fast Food Restaurant Internet Retailer Wholesale Food Distributor Grocery Store Advertising Agency Software Developer Exhibit 1-Common Size Statements Common Size Balance Sheet Company Year End 1 2 3 4 5 6 7 8 9 10 11 12 13 31-Dec 1-Feb 29-Nov 31-Dec 31-Dec 31-Dec 1-Feb 31-Dec 28-Sep 31-Dec 29-Jun 31-Dec 31-Dec Assets Cash 1.7% 3.5% 20.1% 6.6% 16.1% 5.1% 6.0% 24.4% 29.7% 12.4% 2.9% 3.1% 1.9% AR 2.1% 3.8% 7.4% 2.9% 29.2% 2.6% 0.0% 9.2% 6.8% 8.0% 23.3% 64.0% 4.7% Inv. 0.6% 15.7% 0.0% 3.1% 4.7% 0.7% 21.0% 9.1% 1.2% 7.1% 17.9% 0.0% 0.1% Other CA 2.9% 1.2% 3.8% 1.0% 4.4% 0.2% 3.1% 0.0% 10.4% 5.1% 1.3% 22.6% 0.8% Total Current Assets 7.4% 24.1% 31.3% 13.7% 54.5% 8.6% 30.2% 42.8% 48.1% 32.6% 45.3% 89.7% 7.5% Net PP&E 75.6% 63.4% 6.2% 72.9% 7.7% 84.1% 66.7% 43.4% 11.0% 17.8% 25.1% 1.7% 78.8% Goodwill 0.8% 6.8% 51.5% 6.8% 35.2% 0.0% 0.0% 6.6% 0.0% 23.0% 21.7% 2.5% 5.6% Intangibles & Other 16.3% 5.8% 11.0% 6.6% 2.6% 7.3% 3.2% 7.2% 40.9% 26.6% 7.9% 6.1% 8.1% Total Assets 100.0% 100.0% 100.0% 100.0% 100.0% 100.0% 100.0% 100.0% 100.0% 100.0% 100.0% 100.0% 100.0% Liabilities AP 2.0% 14.0% 1.0% 3.4% 43.9% 2.7% 23.2% 20.9% 13.7% 4.4% 24.0% 75.0% 2.1% ST Debt 5.4% 5.7% 15.2% 4.8% 2.3% 0.6% 0.4% 6.4% 3.0% 4.3% 0.2% 0.8% 0.1% Other CL 3.4% 11.8% 23.3% 22.3% 13.4% 2.3% 10.3% 11.7% 14.5% 17.6% 9.7% 1.4% 5.4% Total Current Liabilities 10.8% 31.5% 39.4% 30.5% 59.7% 5.6% 33.9% 39.0% 31.2% 26.3% 34.0% 77.2% 7.6% LT Debt 31.9% 41.1% 4.8% 48.1% 25.4% 43.1% 31.8% 28.1% 27.1% 26.9% 45.2% 8.8% 98.7% Other LTL 25.9% 8.4% 5.1% 21.5% 2.3% 20.3% 6.7% 5.4% 14.9% 15.9% 6.7% 1.4% 11.0% Total Liabilities 68.6% 81.1% 49.3% 100.2% 87.4% 69.0% 72.3% 72.4% 73.3% 69.2% 85.9% 87.5% 117.3% Non-Controlling Interest 0.3% -0.1% 0.0% 0.0% 1.9% 0.0% 0.0% 0.0% 0.0% 0.1% 0.2% 0.0% 0.0% Net Contributed Capital Retained Earning + AOCI 12.0% -25.9% -19.8% 6.6% -14.0% 2.9% 14.7% 14.7% 13.3% -17.2% -39.7% 1.0% -123.5% 19.1% 44.9% 70.5% -6.8% 24.7% 28.0% 13.0% 13.4% 13.4% 47.9% 53.6% 11.5% 106.2% Total Equity 31.4% 18.9% 50.7% -0.2% 12.6% 31.0% 27.7% 27.6% 26.7% 30.8% 14.1% 12.5% -17.3% Total Liabilities & Equity 100.0% 100.0% 100.0% 100.0% 100.0% 100.0% 100.0% 100.0% 100.0% 100.0% 100.0% 100.0% 100.0% Key Ratios Exhibit 1-Key Ratios Company Revenue Growth Gross Margin Net Margin (ROS) 1 2 3 4 5 6 7 8 9 10 11 12 13 1.9% 0.4% 23.7% 2.8% -2.2% 10.4% 3.7% 20.5% -2.0% 10.7% 2.4% 22.8% 0.2% 77.5% 22.1% 93.8% -n/a- -n/a- -n/a- 28.9% -3.2% 32.2% 69.9% 19.0% -n/a- 17.6% 11.5% 1.4% 26.4% 3.7% 9.0% 27.9% 4.2% 4.1% 21.2% 21.0% 2.8% 24.7% 28.6% CF From Operations ($ MM) $ 3,134 $ 4,024 $ 4,422 $ 3,815 $ 1,856 $ 4,850 $ 7,117 $ 38,514 $ 69,391 $ 13,440 $ 2,411 $ 1,824 $ 8,122 Asset Turnover 0.22x 2.70x 0.54x 0.76x 0.56x 0.31x 1.83x 1.25x 0.77x 0.55x 3.35x 0.06x 0.44x Return on Assets (ROA) 2.5% 3.7% 14.2% 2.8% 5.0% 8.7% 7.7% 5.1% 16.3% 11.7% 9.3% 1.4% 12.7% Financial Leverage 3.19x 5.28x 1.97x -508.43x 7.94x 3.22x 3.62x 3.63x 3.74x 3.25x 7.08x 7.99x -5.79x Return on Equity (ROE) 7.9% 19.4% 28.0% -1428.8% 39.7% 28.1% 27.7% 18.7% 61.1% 37.9% 66.0% 11.4% -73.4% Current Ratio 0.68 0.76 0.79 0.45 0.91 1.52 0.89 1.10 1.54 1.24 1.33 -n/a- 0.98 AR Days (Recievables Collection) 36 days 5 days Inventory Turnover 3.10x 13.50x 50 days -n/a- 14 days -n/a- 191 days -n/a- 30 days -n/a- Odays 6.10x 27 days 8.10x 32 days 53 days 25 days 4040 days 39 days 35.30x 2.40x 15.10x -n/a- 155.20x Dividend Payout Ratio 64.2% 29.3% 0.0% 10.6% 42.1% 22.9% 40.5% 0.0% 25.6% 57.9% 46.3% 31.1% 59.5% R&D Expense Ratio 0.37% -n/a- 17.28% -n/a- -n/a- -n/a- -n/a- 12.81% 6.23% 21.08% -n/a- -n/a- -n/a-
Step by Step Solution
There are 3 Steps involved in it
Step: 1

Get Instant Access to Expert-Tailored Solutions
See step-by-step solutions with expert insights and AI powered tools for academic success
Step: 2

Step: 3
Ace Your Homework with AI
Get the answers you need in no time with our AI-driven, step-by-step assistance
Get Started
International Marketing And Export Management
Authors: Gerald Albaum , Alexander Josiassen , Edwin Duerr
8th Edition
1292016922, 978-1292016924