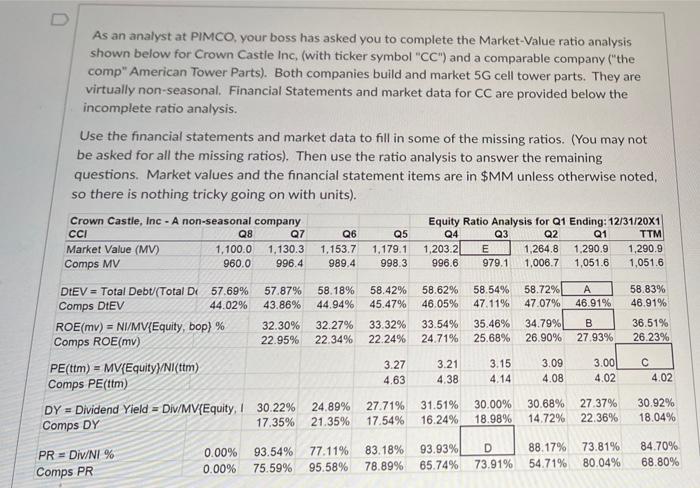
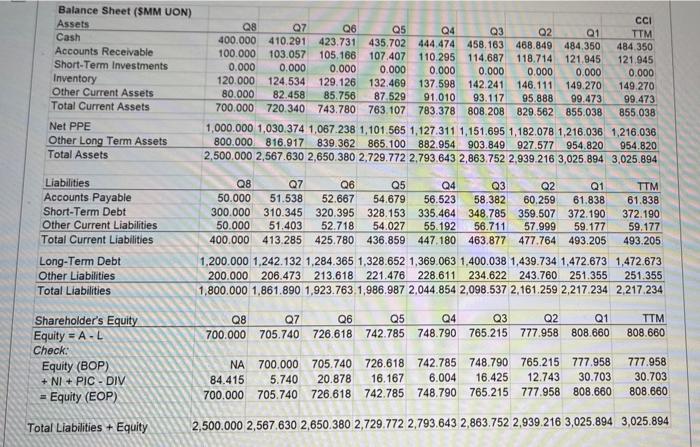
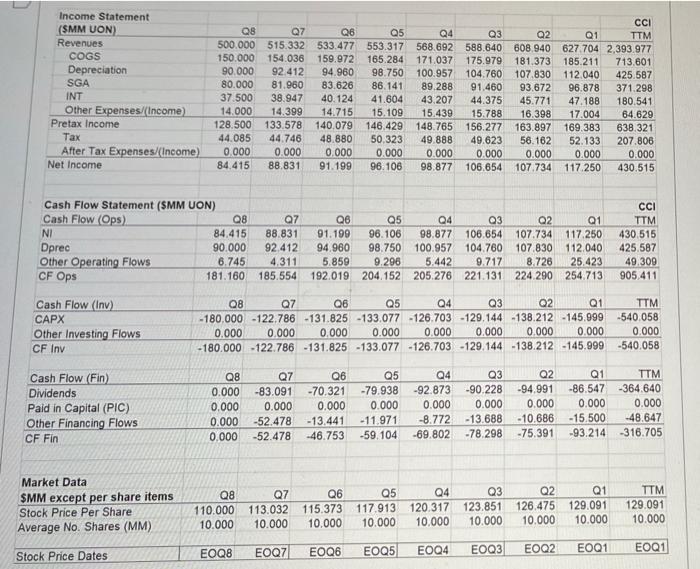
As an analyst at PIMCO, your boss has asked you to complete the Market Value ratio analysis shown below for Crown Castle Inc. (with ticker symbol "CC") and a comparable company ("the comp" American Tower Parts). Both companies build and market 5G cell tower parts. They are virtually non-seasonal Financial Statements and market data for CC are provided below the incomplete ratio analysis. Use the financial statements and market data to fill in some of the missing ratios. (You may not be asked for all the missing ratios). Then use the ratio analysis to answer the remaining questions. Market values and the financial statement items are in $MM unless otherwise noted, so there is nothing tricky going on with units). Crown Castle, Inc - A non-seasonal company Equity Ratio Analysis for Q1 Ending: 12/31/20X1 CCI Q8 Q7 Q6 Q5 Q2 Q1 TTM Market Value (MV) 1,100.0 1,130.3 1.153.7 1.179.1 1,203.2 E 1,264.8 1.290.9 1,290.9 Comps MV 960.0 996.4 989.4 998.3 996.6 979.1 1,006.7 1,051.6 1,051.6 Q4 Q3 58.18% 44.94% 58.42% 45.47% 58.54% 47.11% 58.72% 47.07% A 46.91% 58.62% 46.05% 33.54% 24.71% 58.83% 46.91% 36.51% 26.23% 32.27% 22.34% 33.32% 22.24% 35.46% 25.68% 34.79% B 26.90% 27.93% DIEV = Total Debt/(Total D 57.69% 57.87% Comps DIEV 44.02% 43.86% ROE(mv) = NI/MV/Equity, bop) % 32.30% Comps ROE(mv) 22.95% PE(ttm) = MV(Equity/NI(tim) Comps PE(ttm) DY = Dividend Yield = Div/MV(Equity, I 30.22% Comps DY 17.35% 3.00 3.27 4.63 3.21 4.38 3.15 4.14 3.09 4.08 4.02 4.02 24.89% 21.35% 27.71% 17.54% 31.51% 16.24% 30.00% 18.98% 30.68% 14.72% 27.37% 22.36% 30.92% 18.04% PR = Div/NI % Comps PR 0.00% 0.00% 93.54% 75.59% 77.11% 95.58% 83.18% 78.89% 93.93% 65.74% D 73.91% 88.17% 54.71% 73.81% 80.04% 84.70% 68.80% Balance Sheet (SMM UON) Assets Cash Accounts Receivable Short-Term Investments Inventory Other Current Assets Total Current Assets CCI Q8 Q7 Q6 Q5 Q4 Q3 Q2 Q1 TTM 400.000 410.291 423.731 435.702 444.474 458.163 468.849 484.350 484.350 100.000 103.057 105 106 107 407 110.295 114.687 118.714 121.945 121.945 0.000 0.000 0.000 0.000 0.000 0.000 0.000 0.000 0.000 120.000 124.534 129.126 132.469 137.598 142.241 146.111 149.270 149.270 80.000 82.458 85.756 87 529 91.010 93.117 95.888 99.473 99.473 700.000 720.340 743.780 763.107 783.378 808.208 829.562 855.038 855.038 1.000.000 1,030.374 1,067 238 1,101.565 1,127.311 1,151.695 1,182.078 1,216.036 1,216.036 800.000 816.917 839.362 865.100 882.954 903.849 927.577 954.820 954.820 2,500,000 2,567.630 2,650 380 2,729.772 2.793 643 2,863.752 2,939.216 3,025 894 3,025.894 Net PPE Other Long Term Assets Total Assets Liabilities Accounts Payable Short-Term Debt Other Current Liabilities Total Current Liabilities Long-Term Debt Other Liabilities Total Liabilities Q8 Q7 Q6 Q5 Q4 Q3 Q2 Q1 TTM 50.000 51.538 52.667 54.679 56.523 58.382 60.259 61.838 61.838 300.000 310.345 320.395 328.153 335.464 348.785 359.507 372.190 372.190 50.000 51.403 52.718 54.027 55.192 56.711 57.999 59.177 59.177 400.000 413.285 425.780 436.859 447 180 463.877 477.764 493.205 493.205 1,200.000 1.242.132 1.284.365 1,328.652 1,369.063 1,400.038 1,439.734 1,472.673 1,472.673 200.000 206.473 213.618 221.476 228.611 234.622 243.760 251.355 251.355 1.800.000 1,861.890 1,923.763.1,986.987 2,044.854 2,098.537 2 161.259 2,217 234 2.217.234 Q6 Q8 Q7 Q5 Q4 Q3 Q2 Q1 700.000 705.740 726.618 742.785 748.790 765.215 777.958 808.660 TTM 808.660 Shareholder's Equity Equity = A-L Check: Equity (BOP) + NI + PIC - DIV Equity (EOP) NA 700.000 705.740 726.618 742.785 748.790 765.215 777.958 84.415 5.740 20.878 16.167 6.004 16.425 12.743 30.703 700.000 705.740 726.618 742.785 748.790 765.215 777.958 808.660 777.958 30.703 808.660 Total Liabilities + Equity + 2,500,000 2,567.630 2,650.380 2,729.772 2,793,643 2,863.752 2,939.216 3,025.894 3,025.894 Income Statement (SMM UON Revenues COGS Depreciation SGA INT Other Expenses/(Income) Pretax Income Tax After Tax Expenses/(Income) Net Income Q8 Q7 Q6 Q5 500.000 515.332 533.477 553.317 150.000 154.036 159.972 165.284 90.000 92.412 94.960 98.750 80.000 81.960 83.626 86.141 37.500 38.947 40. 124 41.604 14.000 14.399 14.715 15.109 128.500 133.578 140.079 146,429 44.085 44.746 48.880 50.323 0.000 0.000 0.000 0.000 84.415 88.831 91.199 96.106 Q4 Q3 568.692 588.640 171.037 175.979 100.957 104.760 89.288 91.460 43.207 44.375 15.439 15.788 148.765 156.277 49.888 49.623 0.000 0.000 98.877 106.654 CCI Q2 Q1 TTM 608.940 627 704 2,393.977 181.373 185.211 713,601 107.830 112.040 425.587 93.672 96.878 371.298 45.771 47.188 180.541 16.398 17.004 64.629 163.897 169.383 638.321 56.162 52.133 207.806 0.000 0.000 0.000 107.734 117.250 430.515 Q3 Q2 Cash Flow Statement (SMM UON) Cash Flow (Ops) Q8 NI 84.415 Dprec 90.000 Other Operating Flows 6.745 CF Ops 181.160 Q7 88.831 92.412 4.311 185.554 Q6 Q5 Q4 91.199 96.106 98.877 106.654 94.960 98.750 100.957 104.760 5.859 9.296 5.442 9.717 192.019 204.152 205.276 221.131 Q1 107.734 117.250 107.830 112.040 8.726 25.423 224.290 254.713 CCI TTM 430 515 425,587 49.309 905,411 Cash Flow (Inv) CAPX Other Investing Flows CF Inv Q8 Q7 Q6 Q5 04 Q3 Q2 Q1 TTM -180,000 -122.786 -131.825 -133.077 -126.703 -129.144 -138.212 -145.999 540 058 0.000 0.000 0.000 0.000 0.000 0.000 0.000 0.000 0.000 - 180.000 -122.786 -131.825 -133.077 -126.703 -129.144 -138.212 -145.999 -540.058 Q2 Q1 Cash Flow (Fin) Dividends Paid in Capital (PIC) Other Financing Flows CF Fin Q8 0.000 0.000 0.000 0.000 Q7 -83.091 0.000 -52.478 -52.478 Q6 -70.321 0.000 -13.441 -46.753 Q5 -79.938 0.000 -11.971 -59.104 Q4 -92.873 0.000 -8.772 -69.802 Q3 -90.228 -94.991 0.000 0.000 - 13.688 -10.686 -78.298 - 75.391 -86.547 0.000 -15.500 -93.214 TTM -364.640 0.000 -48.647 -316.705 Market Data SMM except per share items Stock Price Per Share Average No. Shares (MM) Q8 110.000 10.000 Q7 Q6 113.032 115.373 10.000 10.000 Q5 117.913 10.000 Q4 120.317 10.000 Q3 123.851 10.000 Q2 126,475 10.000 Q1 129.091 10.000 TTM 129.091 10.000 EOQ7 EOQ6 EOQ8 EOQ5 EOQ4 EOQ3 EOQ2 Stock Price Dates EOQ1 EOQ1 What is ratio C? What is quantity E