

Answered step by step
Verified Expert Solution
Question
1 Approved Answer
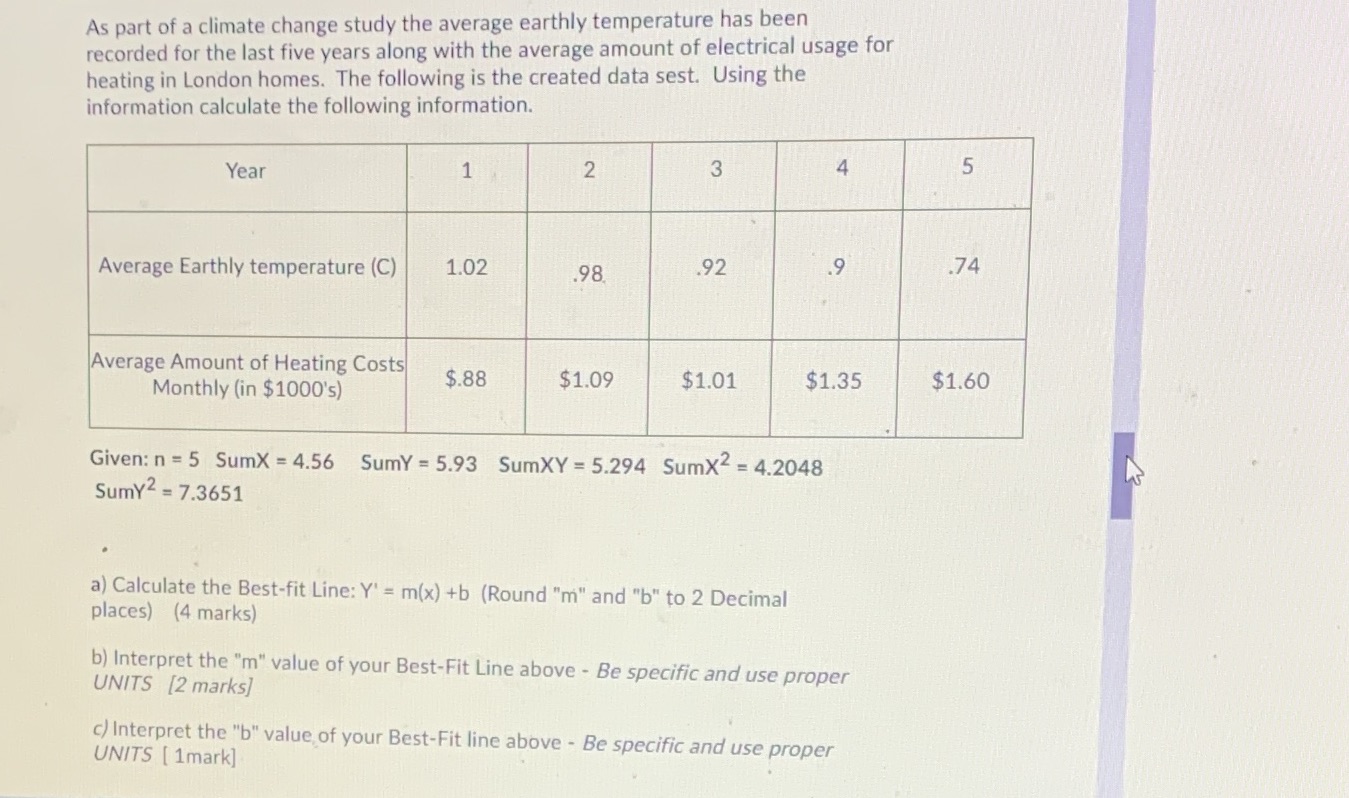
As part of a climate change study the average earthly temperature has been recorded for the last five years along with the average amount of
Step by Step Solution
There are 3 Steps involved in it
Step: 1

Get Instant Access to Expert-Tailored Solutions
See step-by-step solutions with expert insights and AI powered tools for academic success
Step: 2

Step: 3
Ace Your Homework with AI
Get the answers you need in no time with our AI-driven, step-by-step assistance
Get Started
Geometry, Structure And Randomness In Combinatorics
Authors: Ji?í Matousek, Jaroslav Nešet?il, Marco Pellegrini
1st Edition
887642525X, 9788876425257