

Answered step by step
Verified Expert Solution
Question
1 Approved Answer
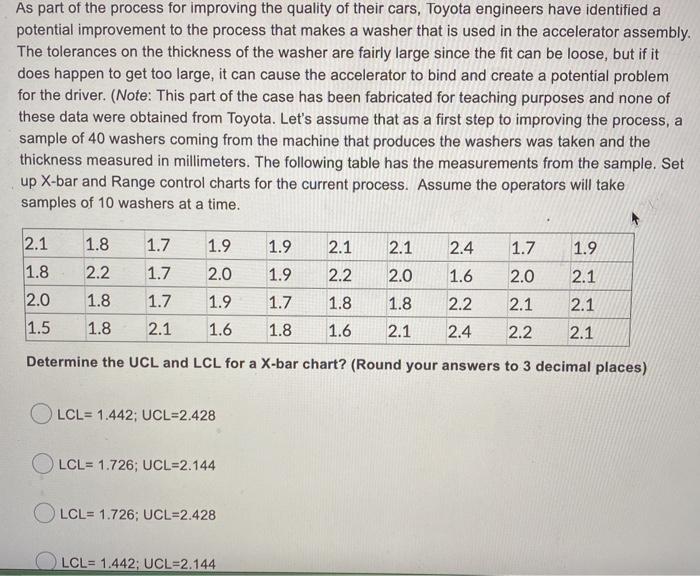
As part of the process for improving the quality of their cars, Toyota engineers have identified a potential improvement to the process that makes a
Step by Step Solution
There are 3 Steps involved in it
Step: 1

Get Instant Access to Expert-Tailored Solutions
See step-by-step solutions with expert insights and AI powered tools for academic success
Step: 2

Step: 3
Ace Your Homework with AI
Get the answers you need in no time with our AI-driven, step-by-step assistance
Get Started
The Concise Guide To Mergers Acquisitions And Divestitures Business Legal Finance Accounting Tax And Process Aspects
Authors: R. Brown
1st Edition
0230600786,0230608949