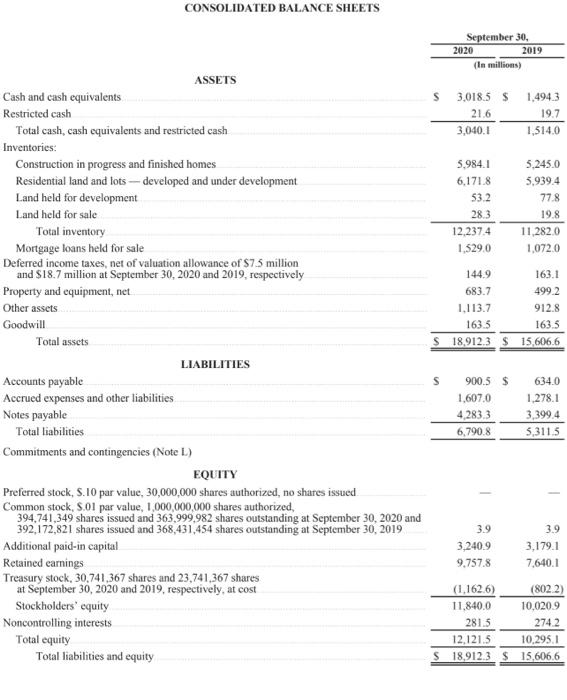
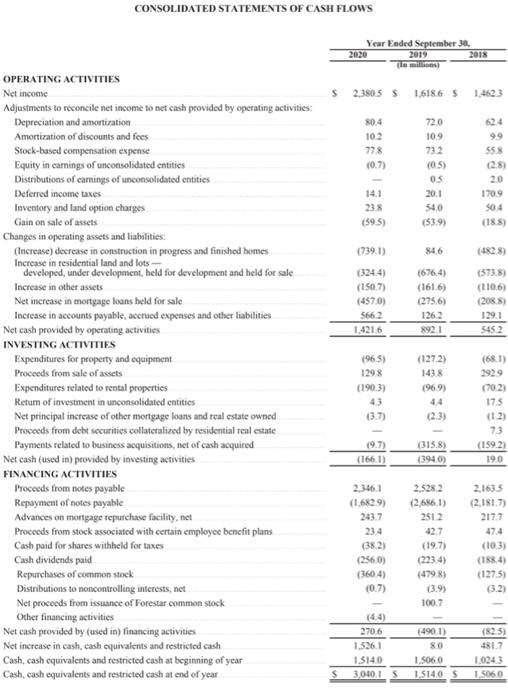
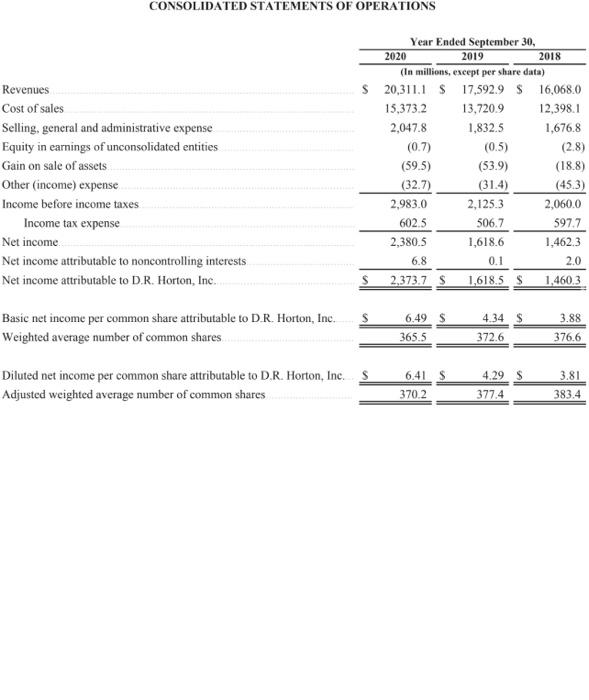
As per the attached balance sheet, income statement and Cash flow please kindly answer the below and show workout. Please use the following formulas if applicable.
1.) the Number of Days of Payables = Number of Days in period / Payables Turnover
2.) Working Capital Turnover = Revenue / Average Working Capital
3.) Fixed Asset Turnover= Revenue / Average net Fixed Asset
4.) Total Asset Turnover = = Revenue / Average Total Assets
CONSOLIDATED BALANCE SHEETS September 30, 2020 2019 (in millions) S 3,018.5 21.6 3,040.1 1.494.3 19.7 1.514.0 5.984.1 6,171.8 53.2 28.3 12.237.4 1.529.0 5,245.0 5.939.4 77.8 19.8 11,282.0 1,072.0 144.9 163.1 683.7 499.2 1.113.7 912.8 1635 1635 18,912.3 $ 15,606.6 S ASSETS Cash and cash equivalents Restricted cash Total cash, cash equivalents and restricted cash Inventories: Construction in progress and finished homes Residential land and lots --developed and under development Land held for development Land held for sale Total inventory Mortgage loans held for sale Deferred income taxes, net of valuation allowance of $7.5 million and $18.7 million at September 30, 2020 and 2019, respectively Property and equipment, net Other assets Goodwill Total assets LIABILITIES Accounts payable Accrued expenses and other liabilities Notes payable Total liabilities Commitments and contingencies (Note L.) EQUITY Preferred stock, S. 10 par value, 30,000,000 shares authorized, no shares issued Common stock, S.01 par value, 1,000,000,000 shares authorized, 394,741,349 shares issued and 363,999,982 shares outstanding at September 30, 2020 and 392,172,821 shares issued and 368,431,454 shares outstanding at September 30, 2019 Additional paid-in capital Retained earnings Treasury stock, 30,741,367 shares and 23,741,367 shares at September 30, 2020 and 2019, respectively, at cost Stockholders' equity Noncontrolling interests Total equity Total liabilities and equity s 900.5$ 1,607,0 4,283,3 6.790.8 634.0 1.278.1 3,399.4 5,311.5 3.9 3.240.9 9.757.8 3.9 3.179.1 7.640.1 (1.162.6) (8022) 11.840,0 10,0209 281.5 274.2 12.121.5 10,295.1 $18.912.3 $ 15,6066 CONSOLIDATED STATEMENTS OF CASH FLOWS Year Ended September 30, 2020 2019 2018 $ 23805S 1618.6 S 1.4623 80.4 102 77% (0.7) 720 10.9 732 (0.5) OS 20:1 $4,0 (53.9) 624 99 55 2.81 2.0 1709 50.4 (188) 14.1 23% (595) (739.1) 846 (3244) (1507) (4570) 5662 1,421.6 (676,4) (1616) (275,6) 1262 8921 (373.8) (1106) (208.8) 1291 3452 OPERATING ACTIVITIES Net income Adjustments to reconcile net income to net cash provided by operating activities Depreciation and amortization Amortization of discounts and fees Stock-based compensation expense Equity in carings of unconsolidated entities Distributions of camings of unconsolidated entities Deferred income taxes Inventory and land option charges Gain on sale of assets Changes in operating assets and liabilities: (Increase) decrease in construction in progress and finished homes Increase in residential land and lots developed, under development, held for development and held for sale Increase in other assets Net increase in mortgage loans held for sale Increase in accounts payable, accrued expenses and other liabilities Net cash provided by operating activities INVESTING ACTIVITIES Expenditures for property and equipment Proceeds from sale of assets Expenditures related to rental properties Return of investment in unconsolidated entities Net principal increase of other mortgage loans and real estate owned Proceeds from debt securities collateralized by residential real estate Payments related to business acquisitions, net of cash acquired Net cash (used in provided by investing activities FINANCING ACTIVITIES Proceeds from notes payable Repayment of notes payable Advances on mortgage repurchase facility, net Proceeds from stock associated with certain employee bencfit plans Cash paid for shares withheld for taxes Cash dividends paid Repurchases of common stock Distributions to noncontrolling interests, net Net proceeds from issuance of Forestar common stock Other financing activities Net cash provided by (used in) financing activities Net increase in cash, cash equivalents and restricted cash Cash, cash equivalents and restricted cash at beginning of year Cash, cash equivalents and restricted cash at end of year (965) 1298 (190.3) (1272) 1438 (969) 4.4 (2.3) (681) 2929 (702) 175 (12) 73 (1992) 190 (3.7) (9.7) (166.1) (315.8) (3940) 2.346.1 (1.6829) 243.7 23.4 (382) (256,0) (360.4) 2.528.2 (2,686,1) 2512 427 (19.7) (2234) (4798) 2,1635 2.181.7) 2177 47.4 (103) (188.4) (1275) (32) (0.7) (3.9 100,7 (4.4) 270.6 1.526.1 1.514.0 3,040.15 (490.1) 80 1.5060 1.514.05 (825) 481.7 1.0043 1.506,0 CONSOLIDATED STATEMENTS OF OPERATIONS Revenues Cost of sales Selling, general and administrative expense Equity in earnings of unconsolidated entities Gain on sale of assets Other (income) expense Income before income taxes. Income tax expense Net income Net income attributable to noncontrolling interests Net income attributable to D.R. Horton, Inc. Year Ended September 30, 2020 2019 2018 (In millions, except per share data) $ 20,311.1 $ 17,592.9 $ 16,068.0 15,373.2 13,7209 12,398.1 2,047.8 1,832.5 1,676.8 (0.7) (0.5) (2.8) (59.5) (53.9) (18.8) (32.7) (31.4) (453) 2,983.0 2,1253 2,060.0 602.5 506.7 597.7 2,380.5 1,618.6 1,462.3 6.8 0.1 2.0 2.373.7 S 1,618.5 S 1,460.3 S 6.49 $ 4.34 $ Basic net income per common share attributable to D.R. Horton, Inc. Weighted average number of common shares 3.88 376.6 365.5 372.6 Diluted net income per common share attributable to D.R. Horton, Inc. s Adjusted weighted average number of common shares 6.41 $ 370.2 4.29 $ 377.4 3.81 383.4