As you know from Project 4, McCormick & Company is considering a project that requires an initial investment of $350 million to build a new plant and purchase equipment. The investment will be depreciated as a modified accelerated cost recovery system (MACRS) seven-year class asset. The new plant will be built on some of the company's land, which has a current, after-tax market value of $14 million.
You have been asked to refine your work to include the correct tax impact of depreciation, and the cash flow impact of working capital on the capital budget evaluation. The investment will be depreciated as a modified accelerated cost recovery system (MACRS) seven-year class asset. The correct depreciation table is Table 1.
The company will need to finance some of the cash to fund $17 million in receivables and $14 million in Inventory starting at year zero. The company expects vendors to give free credit on purchases of $15 million (accounts Payable). Add the net cash outflow for working capital to the cash outflow for the plant, equipment and land in year zero. The $17 million for receivables and the $14 million for Inventory are cash outflows. The $15 million for receivables is a cash inflow.
Assume that this net working capital is recovered as a cash inflow in year 21. The company still estimates revenues and expenses the same as it did in Project 4 (See Table 2). The company now estimates that it can sell the land in year 21 for $40 million. It will also recover the cash spent on working capital in year 21.
The controller is worried about tax increases and estimates that the tax rate with be raised to 50% (federal and Maryland state) in year 4. Also, there is a concern that expenses are understated. He asks, "What would happen to the NPV calculation if the cash tax expenses come in 2% higher than estimated and the tax rate increases to 50% in year 4?" This will allow a subjective evaluation of the project risk. The new cash flow time line with cash expenses 10% higher than those in Table 2 and with a 50% tax rate are found in Table 3. Table 2 is included for reference.
Question: What would be the net present value, NPV in this "worst case" cash flow? What will be the IRR?
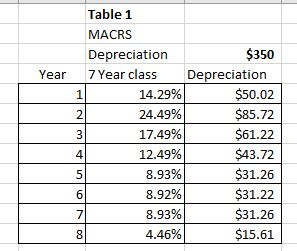
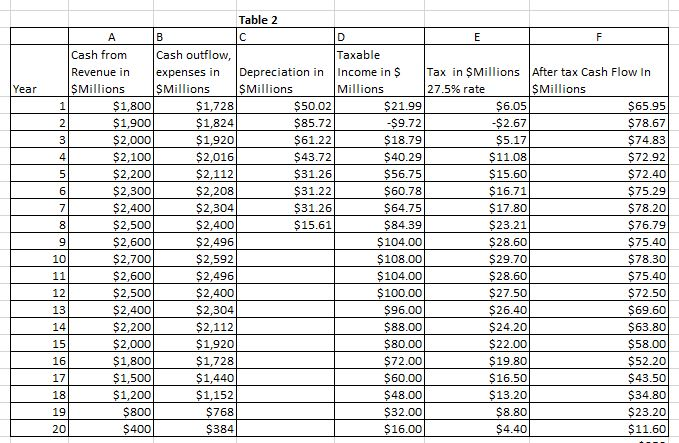
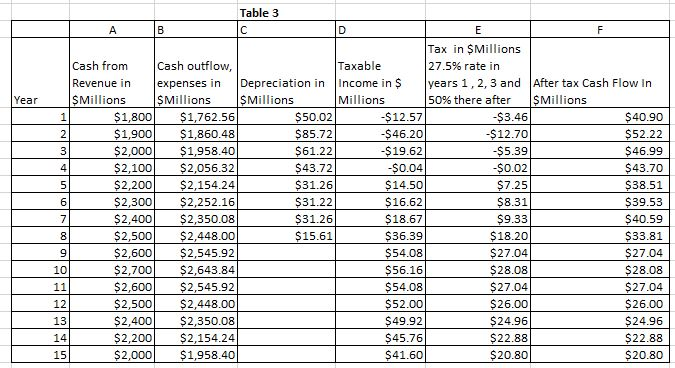
Year Table 1 MACRS Depreciation 7 Year class 1 14.29% 21 24.49% 17.49% 12.49% 5 8.93% 6 8.92% 8.93% 4.46% $350 Depreciation $50.02 $85.72 $61.22 $43.72 $31.26 $31.22 $31.26 $15.61 Table 2 Cash from Cash outflow, Taxable Revenue in expenses in Depreciation in income in $ Tax in Millions After tax Cash Flow In $Millions SMillions SMillions Millions 27.5% rate SMillions $1,800 $1,728 $50.02 $21.99 $6.05 $65.95 $1,900| $1,824 $85.72 $9.72 -$2.67 $78.67 $2,000 $1,9201 $61.22 $18.79 $5.17 $74.83 $2,1001 $2,016 $43.72 $40.29 $11.08 $72.92 $2,200 $2,112 $31.26 $56.75 $15.60 $72.40 $2,300 $2,208 $31.22 $60.78 $16.71 $75.29 $2,400 $2,304 $31.26 $64.75 $17.80 $78.20 $2,500 $2,400 $15.61 $84.39 $23.21 $76.79 $2,600 $2,496 $104.00 $28.60 $75.40 $2,700 $2,592 $108.00 $29.70 $78.30 $2,600 $2,496 $104.00 $28.60 $75.40 $2,500 $2,400 $100.00 $27.50 $72.50 $2,400 $2,304 $96.00 $26.40 $69.60 $2,200 $2,112 $88.00 $24.20 $63.80 $2,000 $1,920 $80.00 $22.00 $58.00 $1,800 $1,728 $72.00 $19.80 $52.20 $1,500 $1,440 $60.00 $16.50 $43.50 $1,200 $1,152 $48.00 $13.20 $34.80 $800 $768 $32.00 $8.80 $23.20 $400 $384 $16.00 $4.40 $11.60 Year Table 3 A B C D EF Tax in SMillions Cash from Cash outflow, Taxable 27.5% rate in Revenue in expenses in Depreciation in Income in $ years 1, 2, 3 and After tax Cash Flow In $Millions $Millions SMillions Millions 50% there after S Millions $1,800 $1,762.56 $50.02 -$12.57 -$3.46 $40.90 $1,900 $1,860.48 $85.72 -$46.200 $12.70 $52.22 $2,000 $1,958.40 $61.22 $19.62 $5.39 $46.99 $2,100 $2,056.32 $43.72 $0.041 -$0.02 $43.70 $2,200 $2.154 $31.26 $14.501 $7.25 $38.51 $2,300 $2,252.16 $31.22 $16.62 $8.31) $39.53 $2,400 $2,350.08 $31.26 $18.67 $9.33 $40.59 $2,500 $2,448.00 $15.61 $36.39 $18.20 $33.81 $2,600 $2,545.92 $54.08. $27.04 $27.04 $2,700 $2,643.84 $56.16 $28.08 $28.08 $2,600 $2,545.92 $54.08 $27.04 $27.04 $2,500 $2,448.00 $52.00 $26.00 $26.00 $2,400 $2,350.08 $49.92 $24.96 $24.96 $2,200 $2,154.24 $45.76 $22.88 $22.88 $2,000 $1,958.40 $41.60 $20.80 $20.80 Year Table 1 MACRS Depreciation 7 Year class 1 14.29% 21 24.49% 17.49% 12.49% 5 8.93% 6 8.92% 8.93% 4.46% $350 Depreciation $50.02 $85.72 $61.22 $43.72 $31.26 $31.22 $31.26 $15.61 Table 2 Cash from Cash outflow, Taxable Revenue in expenses in Depreciation in income in $ Tax in Millions After tax Cash Flow In $Millions SMillions SMillions Millions 27.5% rate SMillions $1,800 $1,728 $50.02 $21.99 $6.05 $65.95 $1,900| $1,824 $85.72 $9.72 -$2.67 $78.67 $2,000 $1,9201 $61.22 $18.79 $5.17 $74.83 $2,1001 $2,016 $43.72 $40.29 $11.08 $72.92 $2,200 $2,112 $31.26 $56.75 $15.60 $72.40 $2,300 $2,208 $31.22 $60.78 $16.71 $75.29 $2,400 $2,304 $31.26 $64.75 $17.80 $78.20 $2,500 $2,400 $15.61 $84.39 $23.21 $76.79 $2,600 $2,496 $104.00 $28.60 $75.40 $2,700 $2,592 $108.00 $29.70 $78.30 $2,600 $2,496 $104.00 $28.60 $75.40 $2,500 $2,400 $100.00 $27.50 $72.50 $2,400 $2,304 $96.00 $26.40 $69.60 $2,200 $2,112 $88.00 $24.20 $63.80 $2,000 $1,920 $80.00 $22.00 $58.00 $1,800 $1,728 $72.00 $19.80 $52.20 $1,500 $1,440 $60.00 $16.50 $43.50 $1,200 $1,152 $48.00 $13.20 $34.80 $800 $768 $32.00 $8.80 $23.20 $400 $384 $16.00 $4.40 $11.60 Year Table 3 A B C D EF Tax in SMillions Cash from Cash outflow, Taxable 27.5% rate in Revenue in expenses in Depreciation in Income in $ years 1, 2, 3 and After tax Cash Flow In $Millions $Millions SMillions Millions 50% there after S Millions $1,800 $1,762.56 $50.02 -$12.57 -$3.46 $40.90 $1,900 $1,860.48 $85.72 -$46.200 $12.70 $52.22 $2,000 $1,958.40 $61.22 $19.62 $5.39 $46.99 $2,100 $2,056.32 $43.72 $0.041 -$0.02 $43.70 $2,200 $2.154 $31.26 $14.501 $7.25 $38.51 $2,300 $2,252.16 $31.22 $16.62 $8.31) $39.53 $2,400 $2,350.08 $31.26 $18.67 $9.33 $40.59 $2,500 $2,448.00 $15.61 $36.39 $18.20 $33.81 $2,600 $2,545.92 $54.08. $27.04 $27.04 $2,700 $2,643.84 $56.16 $28.08 $28.08 $2,600 $2,545.92 $54.08 $27.04 $27.04 $2,500 $2,448.00 $52.00 $26.00 $26.00 $2,400 $2,350.08 $49.92 $24.96 $24.96 $2,200 $2,154.24 $45.76 $22.88 $22.88 $2,000 $1,958.40 $41.60 $20.80 $20.80