Answered step by step
Verified Expert Solution
Link Copied!

Question

1 Approved Answer

Asap plz 17 You are shaking the end of a string up and down to create a sinusoidal wave on the string, shown in the

Asap plz 17

image text in transcribed
You are shaking the end of a string up and down to create a sinusoidal wave on the string, shown in the graph. Which of the graphs below represents the wave on the string when the tension in the string is decreased, but you continue to shake the end of the string up and down at the same rate? y (cm) Original (a) (cma) WNMOUNI UNHOHN W d Ob O a

Step by Step Solution

There are 3 Steps involved in it

Step: 1

blur-text-image

Get Instant Access to Expert-Tailored Solutions

See step-by-step solutions with expert insights and AI powered tools for academic success

Step: 2

blur-text-image

Step: 3

blur-text-image

Ace Your Homework with AI

Get the answers you need in no time with our AI-driven, step-by-step assistance

Get Started

Recommended Textbook for

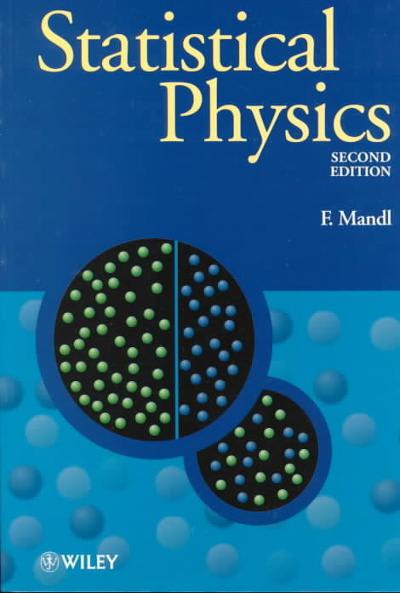
Statistical Physics

Authors: Franz Mandl

2nd Edition

0471915335, 9780471915331

More Books

Students also viewed these Physics questions

Question

Find the equivalent resistance Rab in the circuit of Fig. 2.111?

Answered: 1 week ago

Question

Is money the prime driver of employee performance?

Answered: 1 week ago