

Answered step by step
Verified Expert Solution
Question
1 Approved Answer
ASAP plz (30pts) Graphing Mass and Volume Prepare a graph of mass versus volume from the data collected in Part B. Be sure to title
ASAP plz
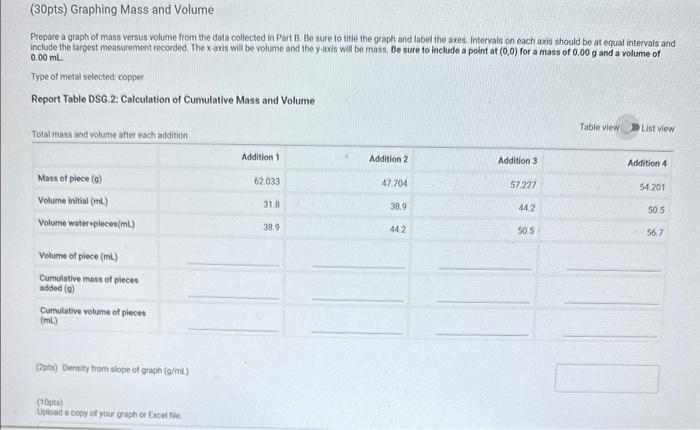
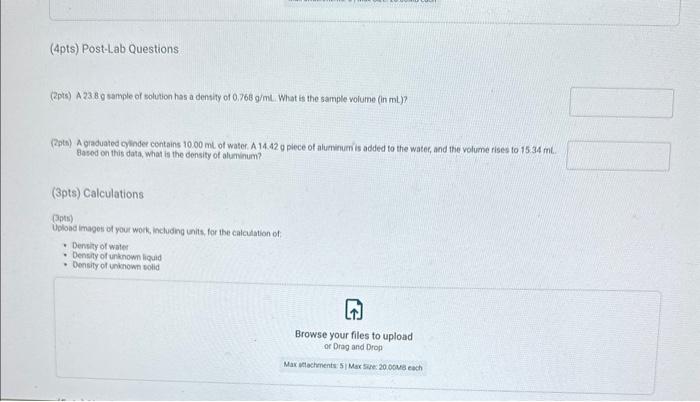
(30pts) Graphing Mass and Volume Prepare a graph of mass versus volume from the data collected in Part B. Be sure to title the graph and label the axes. Intervals on each axis should be at equal intervals and include the largest measurement recorded. The x axis will be volume and the y-axis will be mass. Be sure to include a point at ( 0,0) for a mass of 0.00g and a volume of 0.00mL Type of metal selected: copper Report Table DSG.2: Calculation of Cumulative Mass and Volume Tablevied DList view (2pts) Densily from slope of graph (g/ml) (10ste) Uplosd a copy of your graph ae Ercel fiee. (4pts) Post-Lab Questions (2pts) A 238.8 sample of solution has a dentity of 0.768g/mL. What is the sample volume (in mL)? (Fits) A gaduated ginder contains 10.00mt of water. A 14.42a plece of aluminurnis added to the water, and the volume rises to 15.34mL. Based on this data, what is the density of aluninum? (3pts) Calculations (3pts) Upload imagos of your work, including units, for the calculation of: - Density of wates - Density of unknown liguid - Oensity of uninnown wolid Step by Step Solution
There are 3 Steps involved in it
Step: 1

Get Instant Access to Expert-Tailored Solutions
See step-by-step solutions with expert insights and AI powered tools for academic success
Step: 2

Step: 3
Ace Your Homework with AI
Get the answers you need in no time with our AI-driven, step-by-step assistance
Get Started
Organic Chemistry A Short Course
Authors: Harold Hart, Christopher M. Hadad, Leslie E. Craine, David J. Hart
13th edition
1111425566, 978-1111425562