Question
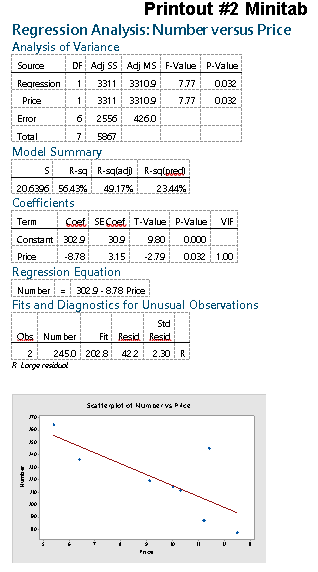
A.Set up the appropriate hypotheses (in plain English) (3 points) B.Draw appropriate statistical conclusions (based on the printout provided).In your conclusions, make sure to indicate
A.Set up the appropriate hypotheses (in plain English) (3 points)
B.Draw appropriate statistical conclusions (based on the printout provided).In your conclusions, make sure to indicate what values you specifically used from the printout (i.e., highlight/mark/circle the relevant values you need from the printout and then use them in your discussion/conclusions). Give the results of your statistical hypothesis test (4 points), interpretation of R Squared (2 points), interpretation of standard error (2 points), and state the regression equation (2 points).
C.Present proper conclusions and recommendations for the business problem (4 points).
6. A list of best-selling cars is shown in the table.The 1988 suggested retail price and the total number sold are given in the table below.
MODEL 1988 Price (in thousands) Number sold (in thousands)
Hyundai 5.4 264
Oldsmobile Cierra 11.4 245
Nissan Sentra 6.4 236
Ford Tempo 9.1 219
Chev. Corsica 10.0 214
Pontiac Grand Am 10.3 211
Toyota Camry 11.2 187
Chev. Caprice 12.5 177
At a = .05, is there evidence of relationship between the two variables?
A H0:
H1:
B. Statistical results:
Interpretation of R-sq.:
Interpretation of S.E.:
Regression equation:
C. Conclusion/recommendation:
Please refer to Printout #2 for this problem
?

Step by Step Solution
There are 3 Steps involved in it
Step: 1

Get Instant Access to Expert-Tailored Solutions
See step-by-step solutions with expert insights and AI powered tools for academic success
Step: 2

Step: 3

Ace Your Homework with AI
Get the answers you need in no time with our AI-driven, step-by-step assistance
Get Started


