

Answered step by step
Verified Expert Solution
Question
1 Approved Answer
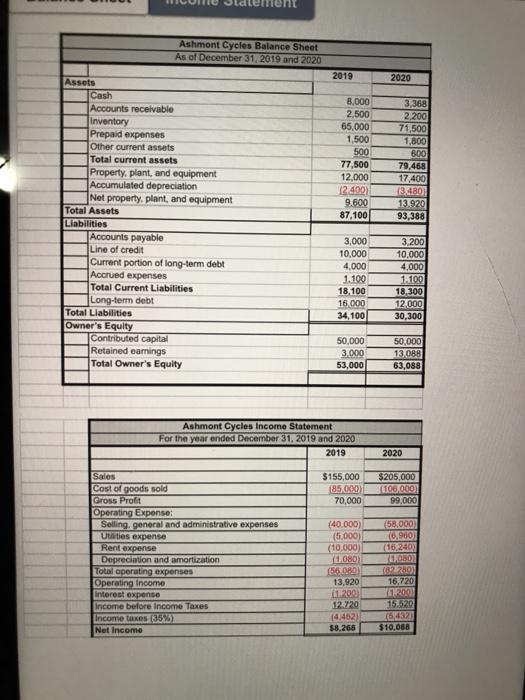
Ashmont Cycles Balance Sheet As of December 31, 2019 and 2020 2019 2020 8.000 2,500 65,000 1,500 500 77,500 12,000 12.400) 9.600 87,100 3,368 2.200

Step by Step Solution
There are 3 Steps involved in it
Step: 1

Get Instant Access to Expert-Tailored Solutions
See step-by-step solutions with expert insights and AI powered tools for academic success
Step: 2

Step: 3
Ace Your Homework with AI
Get the answers you need in no time with our AI-driven, step-by-step assistance
Get Started
Portfolio Performance Measurement And Benchmarking
Authors: Jon Christopherson, David Carino, Wayne Ferson
1st Edition